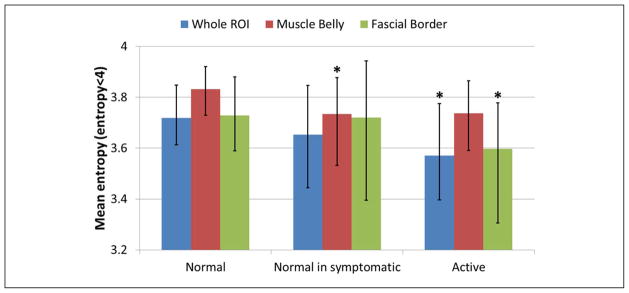
Figure 6.

Mean entropy evaluated in whole ROI (blue bars), muscle belly (red bars), and fascial border (green bars). Bars are median, and error bars are first and third quartiles. Groups significantly different from “normal” (p < 0.05) are marked with asterisks.
ROI = region of interest.
Note: Figure is available in full color in the online version at uix.sagepub.com
