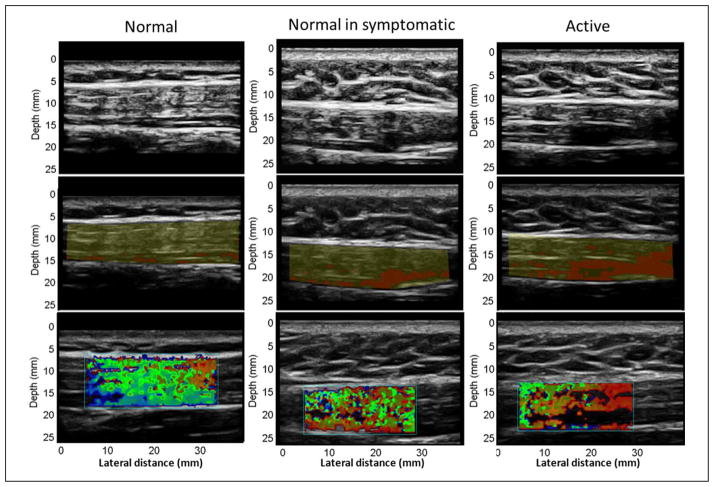
Figure 8.
B-mode, entropy mask, and sonoelasticity matched images. From top to bottom: first row are B-mode images, second row are entropy masks where in red are regions with entropy < 4, third row are sonoelasticity images. From left to right: first column are images of a “normal” site, second column are images of a “normal site in symptomatic,” third column are images of an “active” site.
Note: Figure is available in full color in the online version at uix.sagepub.com

