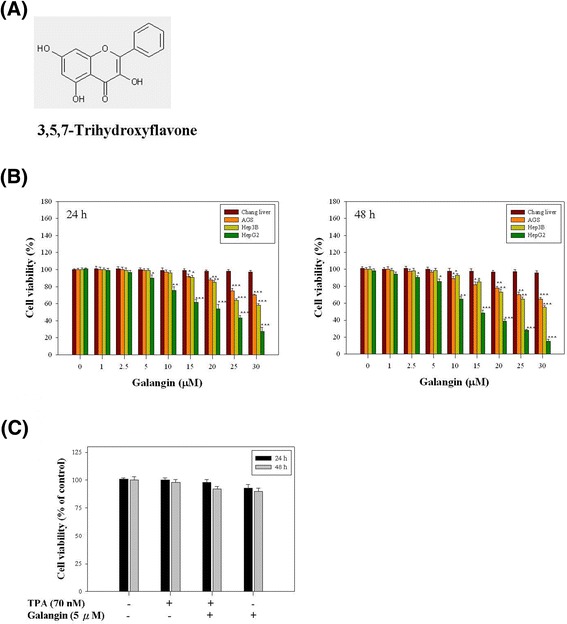
Figure 1.

Effect of galangin on the viability in four cell lines, Chang liver, AGS, Hep3B, and HepG2 cells. (A) Chemical structure of galangin. (B) Four cell lines were treated with or without various concentrations of galangin (0, 1, 2.5, 5, 10, 15, 20, 25, and 30 μM) for 24 and 48 h, separately. (C) HepG2 cells were treated with or without of drugs (70 nM TPA and 5 μM galangin) for 24 and 48 h. Thereafter, cell viability was determined by MTT assay. The survival cell number was directly proportional to formazan, which was measured spectrophotometrically at 563 nm. Values represent mean ± SD of three independent experiments. *p < 0.05, **p < 0.01, ***p < 0.001 compared with the untreated control (dose 0).
