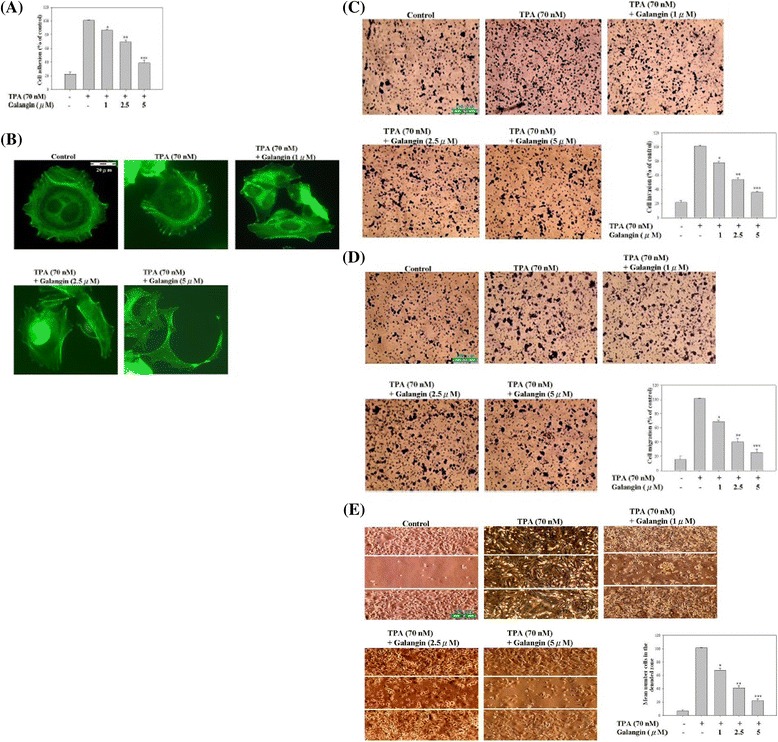
Figure 2.

Effect of galangin on TPA-induced cell-matrix adhesion, cell morphology/actin cytoskeleton arrangement, invasion, and migration in HepG2 cells. Cells were treated with 70 nM TPA for 12 h and incubated in various concentrations of galangin (0, 1, 2.5, and 5 μM) for 24 h, and then were analysed for (A) cell-matrix adhesion, (B) immunofluorescence, scale bar: 20 μm, (C) transwell-chamber invasion, scale bar: 100 μm, (D) transwell-chamber migration, scale bar: 100 μm, and (E) wound-healing, scale bar: 100 μm. The aforementioned methods were described in “Materials and methods” section. Values are expressed as mean ± SD of three independent experiments. *p < 0.05, **p < 0.01, ***p < 0.001 compared with the untreated control (dose 0).
