
Figure 2.
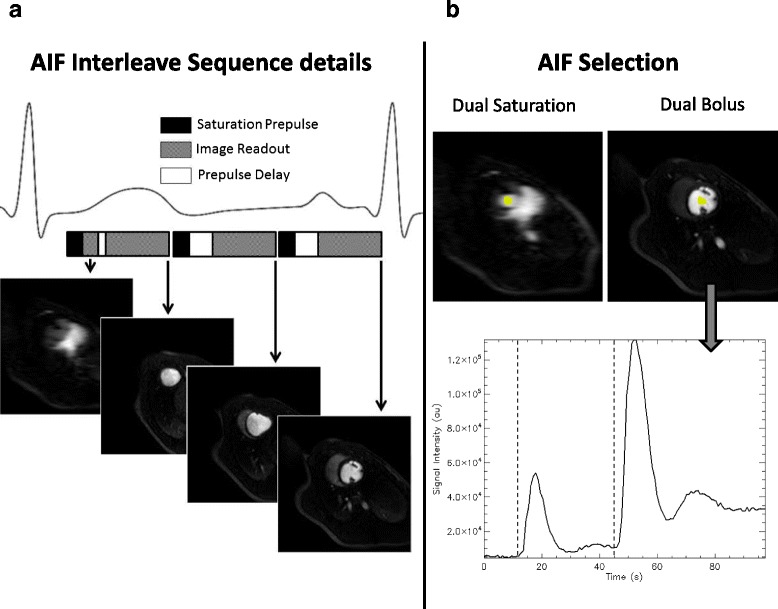
Sequence Details and AIF drawing for Low and High resolution images. a) represents the sequence details showing the short saturation time is interleaved acquired sharing the saturation pulse with the first high resolution image. b) ROI example for AIF selection in the dual saturation and dual bolus cases and an example of the signal-intensity curve at the high resolution. Dotted vertical lines represent the selection of the limits for diluted AIF.