
Figure 3.
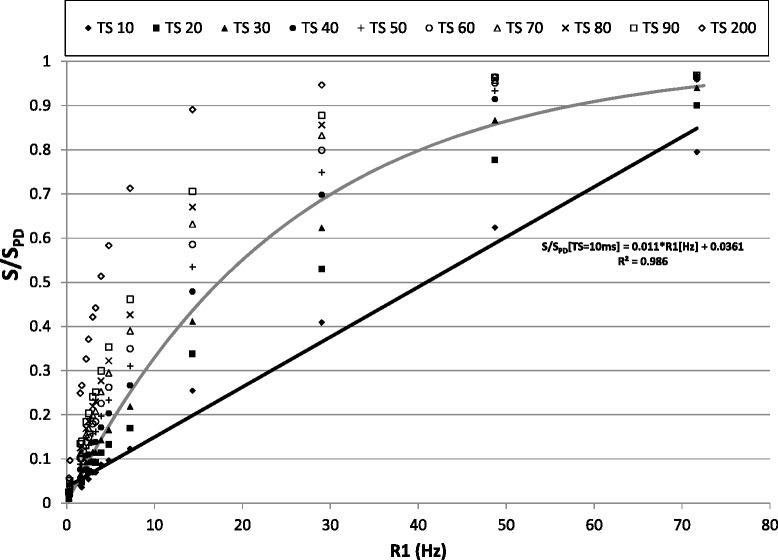
Signal intensity for different Saturation times at several contrast concentration. Signal acquired for different contrast concentrations at different saturation times (10, 20, 30, 40, 50, 60, 70, 80, 90 and 200 ms). The intensity values for each tube (S) were normalized to the signal intensity of the image acquired without saturation pulse, which represents the fully recovered signal after saturation (SPD). The solid black line represents the linear fitting of S/SPD for each tube and different R1 values. The solid gray line represents the conventional saturation recovery signal model for a saturation time of 40 ms.