
Figure 4.
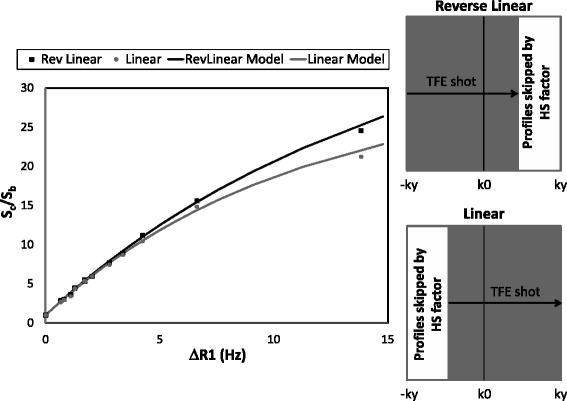
Read-out effects on signal intensity. The graph on the left represents the signal ratio between the signal of the phantoms at different contrast concentrations and the signal of the tube without contrast for Reverse Linear (black squares) and Linear (gray circles) profile ordering. Dotted lines represent the result of the same ratio derived from the signal model described in the appendix for both profile ordering schemes. Solid lines represent the result of the signal model of Sc/Sb described in the Appendix for both readout strategies.