
Figure 5.
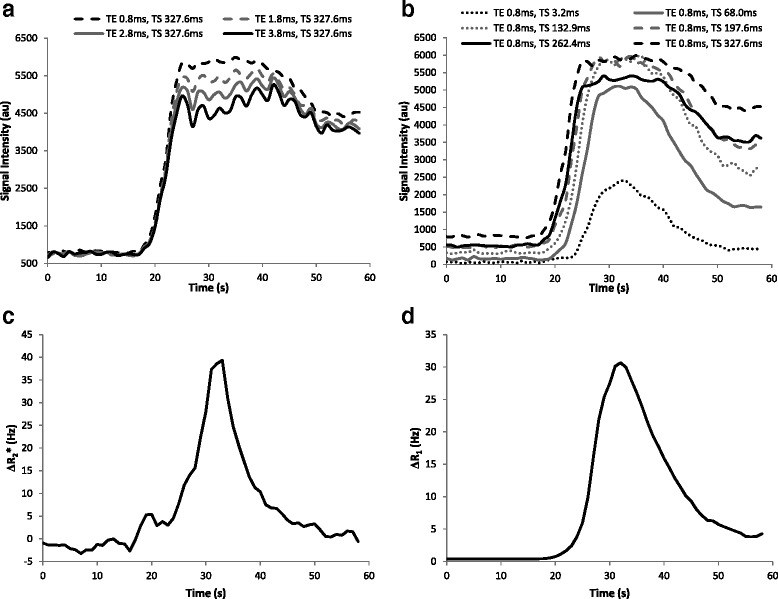
In-vivo effect on the MR signal due to single bolus contrast injection. Example of the signal variation in the aortic blood for different contrast concentrations and different echo times (a) and different saturation times (b), and the corresponding results of the R2* (c) and R1 (d) variations.