
Figure 8.
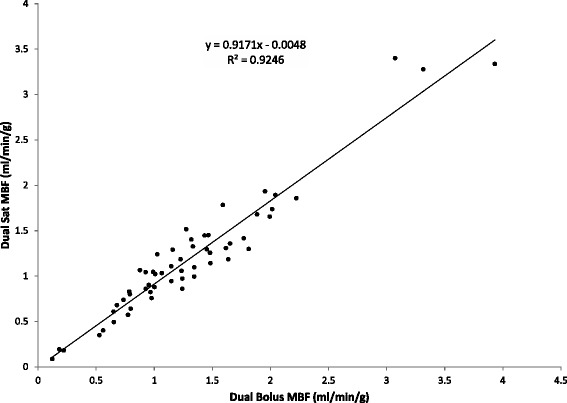
Correlation analysis between Dual Bolus and Dual Saturation MBF. Scatter plot and linear regression fitting (solid line) comparing the quantitative results obtained with the dual-bolus and dual-saturation approaches (black dots).
Official websites use .gov
A
.gov website belongs to an official
government organization in the United States.
Secure .gov websites use HTTPS
A lock (
) or https:// means you've safely
connected to the .gov website. Share sensitive
information only on official, secure websites.
Correlation analysis between Dual Bolus and Dual Saturation MBF. Scatter plot and linear regression fitting (solid line) comparing the quantitative results obtained with the dual-bolus and dual-saturation approaches (black dots).