
Figure 9.
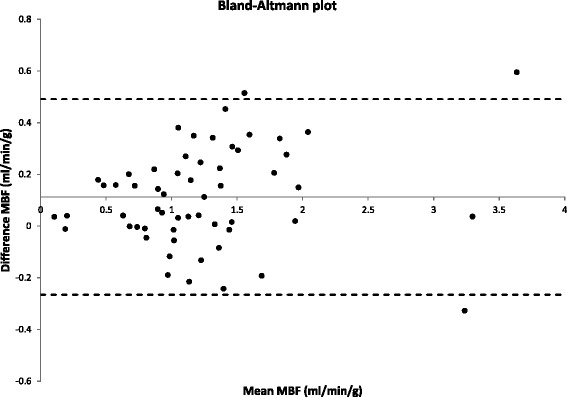
Bias plot between Dual Bolus and Dual Saturation MBF. Bland-Altman plot comparing the quantitative results obtained with the dual-bolus and dual-saturation approaches.
Official websites use .gov
A
.gov website belongs to an official
government organization in the United States.
Secure .gov websites use HTTPS
A lock (
) or https:// means you've safely
connected to the .gov website. Share sensitive
information only on official, secure websites.
Bias plot between Dual Bolus and Dual Saturation MBF. Bland-Altman plot comparing the quantitative results obtained with the dual-bolus and dual-saturation approaches.