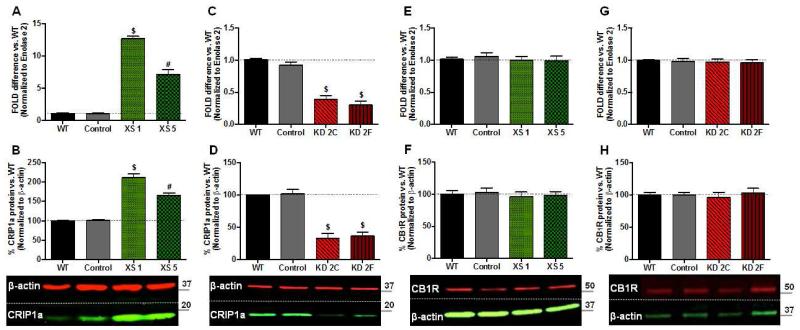
Figure 1. Stable transgenic CRIP1a over-expressing (XS) and knockdown (KD) clones do not alter CB1 receptor expression.
A,C,E,G: N18TG2 WT, empty vector (Control), CRIP1a XS (A,E), and CRIP1a KD cells (C,G) were subjected to qPCR to quantitate mRNA levels of CRIP1a (A, C) and CB1R (E,G). ΔΔCt values are expressed as the fold-difference from WT, represented as 1. B,D,F,H: Protein levels were determined by Western blots of whole cell lysates from N18TG2 WT, empty vector (Control), CRIP1a XS (B,F), and CRIP1a KD cells (D,H). The band density ratio of CRIP1a:β-actin (B,D) or CB1R:β-actin (F,H) were calculated for each individual clone, and normalized to WT as 100%. Below, representative Western blots are shown. Data are expressed as the mean ± S.E.M. from six independent experiments. #p<0.01, $p<0.001 indicates significant difference from WT using Student’s t test.

