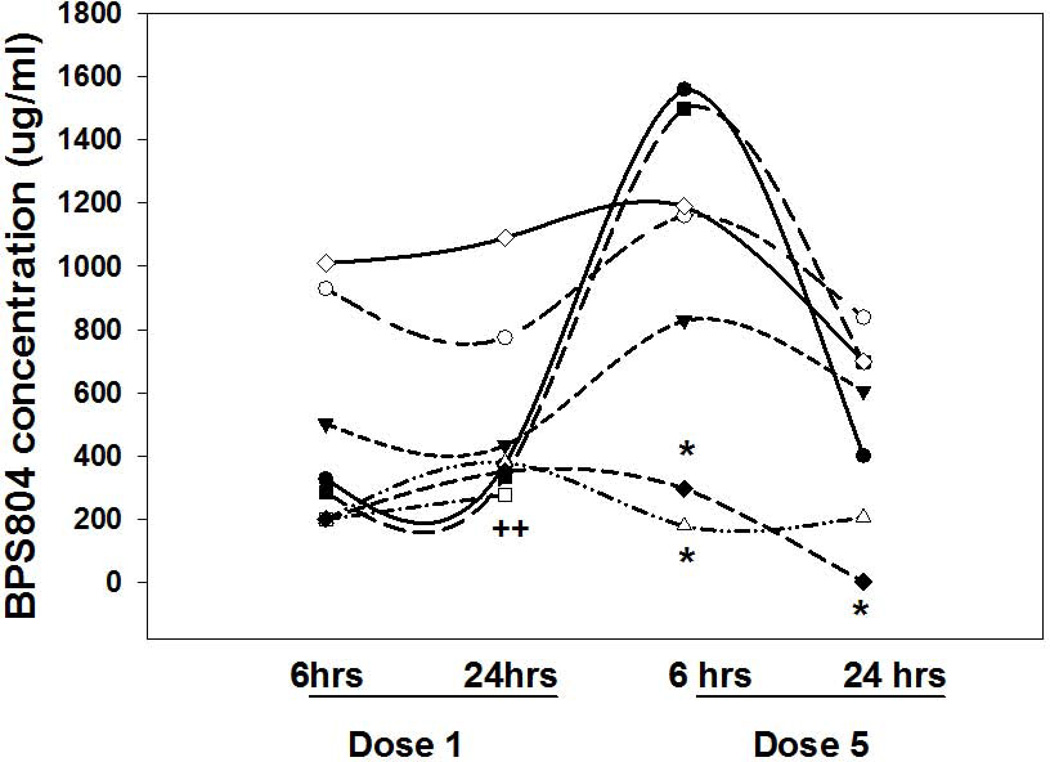
Figure 6. Pharmacokinetic results.
Eight animals had blood drawn for measurement of the anti-sclerostin antibody 6 and 24 hours after the first and fifth dose.. The y-axis represents the measured level of the anti-sclerostin antibody (BPS804) in the blood of each animal. Each symbol represents a different animal. * = the presence of auto-antibodies in serum at that time point. For the animal denoted by the open square (++), levels were undetectable at dose 5 and auto antibodies were present.

