Figure 3.

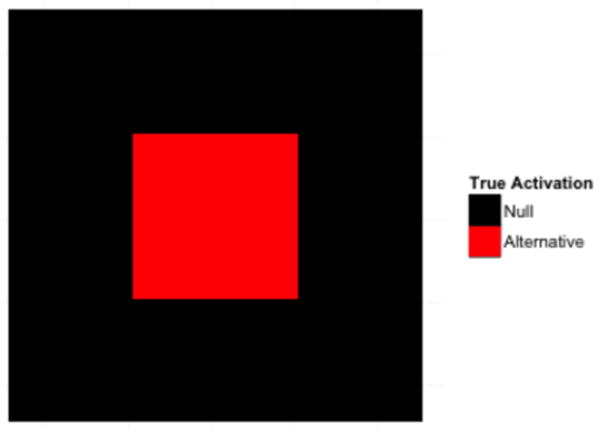
An overview of the underlying true signal found in the statistical maps used in the simulations. Each has dimensions 50×50. In the center of each map there is a square pattern of true activation with dimensions 20×20, shown in red.

An overview of the underlying true signal found in the statistical maps used in the simulations. Each has dimensions 50×50. In the center of each map there is a square pattern of true activation with dimensions 20×20, shown in red.