
Figure 4.
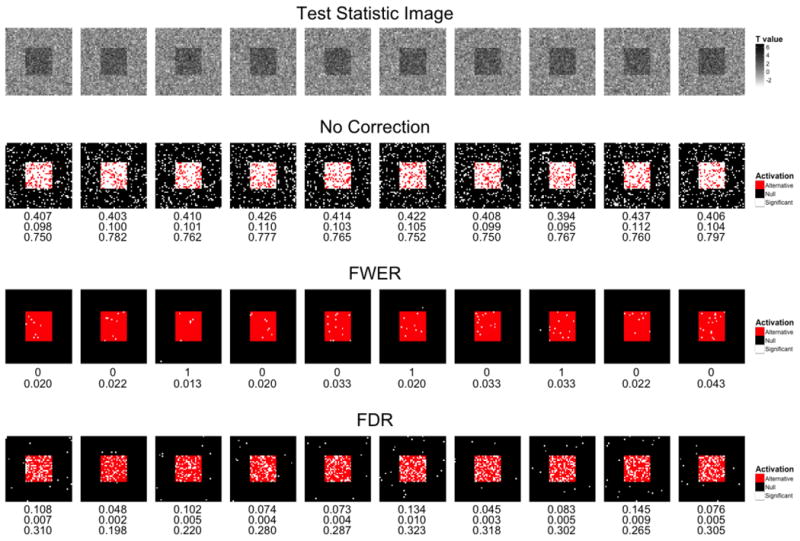
An overview of the effects of various approaches towards dealing with multiple comparisons. (Row 1) Ten t-maps were simulated. (Row 2) These maps were analyzed using an uncorrected threshold α= 0.10. Voxels that exceed the threshold and are considered active are indicated in white. Active voxels that fall inside of the red square shown in Fig. 3 are considered true positives, while those that fall outside the square are considered false positives. The false positive rate, false discovery rate, and power reported are listed under each image. The false positive rate averages 10% as expected. (Row 3) The same images with the threshold designed to control the FWER at 0.10 using Bonferroni correction. There is only one false positive in the 10 images, at the cost of a significant increase in the number of false negatives. The number of false positives and power reported is listed under each image (Row 4) Similar results obtained using an FDR controlling procedure using q=0.10. The false positive rate, false discovery rate, and power reported are listed under each image. The false discovery rate averages 10% as expected.