
Figure 5.
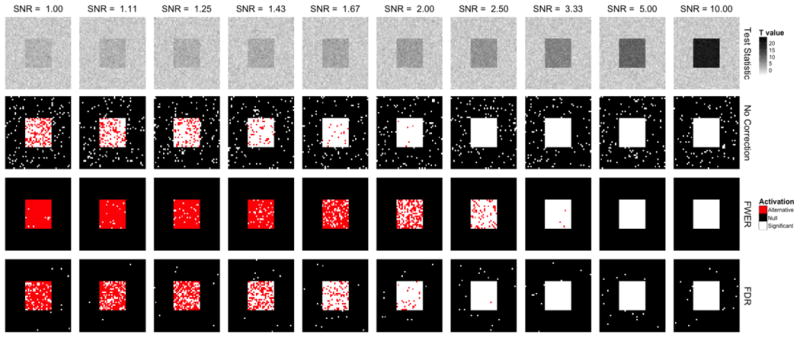
An overview of the effects of various approaches towards dealing with multiple comparisons at different signal-to-noise levels. (Row 1) Ten t-maps were simulated. (Row 2) These maps were analyzed using an uncorrected threshold corresponding α=0.05. Voxels that exceed the threshold and are considered active are indicated in white. Active voxels that fall inside of the red square shown in Fig. 3 are considered true positives, while those that fall outside the square are considered false positives. (Row 3) The same images with the threshold designed to control the FWER at 0.05 using Bonferroni correction. (Row 4) Similar results obtained using an FDR controlling procedure with q=0.05.