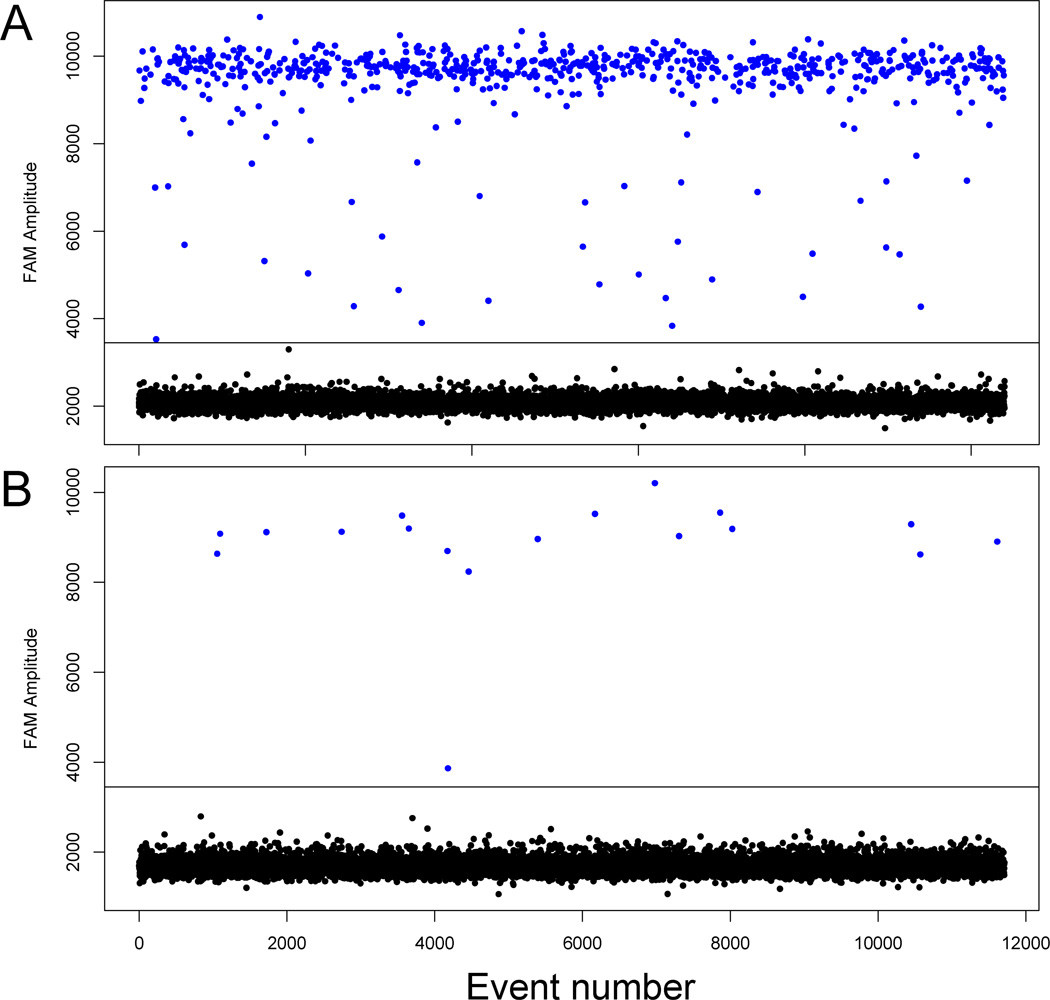
Figure 7. Digital droplet (ddPCR) validation.
Fluorescence amplitude plots for Carboxyfluorescein (FAM) labeled droplets in a representative A) baseline and B) postischemia sample for the intelectin 1 (ITLN1) gene. Each dot represents a single droplet, or event. The event number is displayed on the horizontal axis while the fluorescence amplitude is shown on the vertical axis. The blue dots represent high fluorescence intensity (positive droplets) while the black dots represent low intensity (negative droplets).

