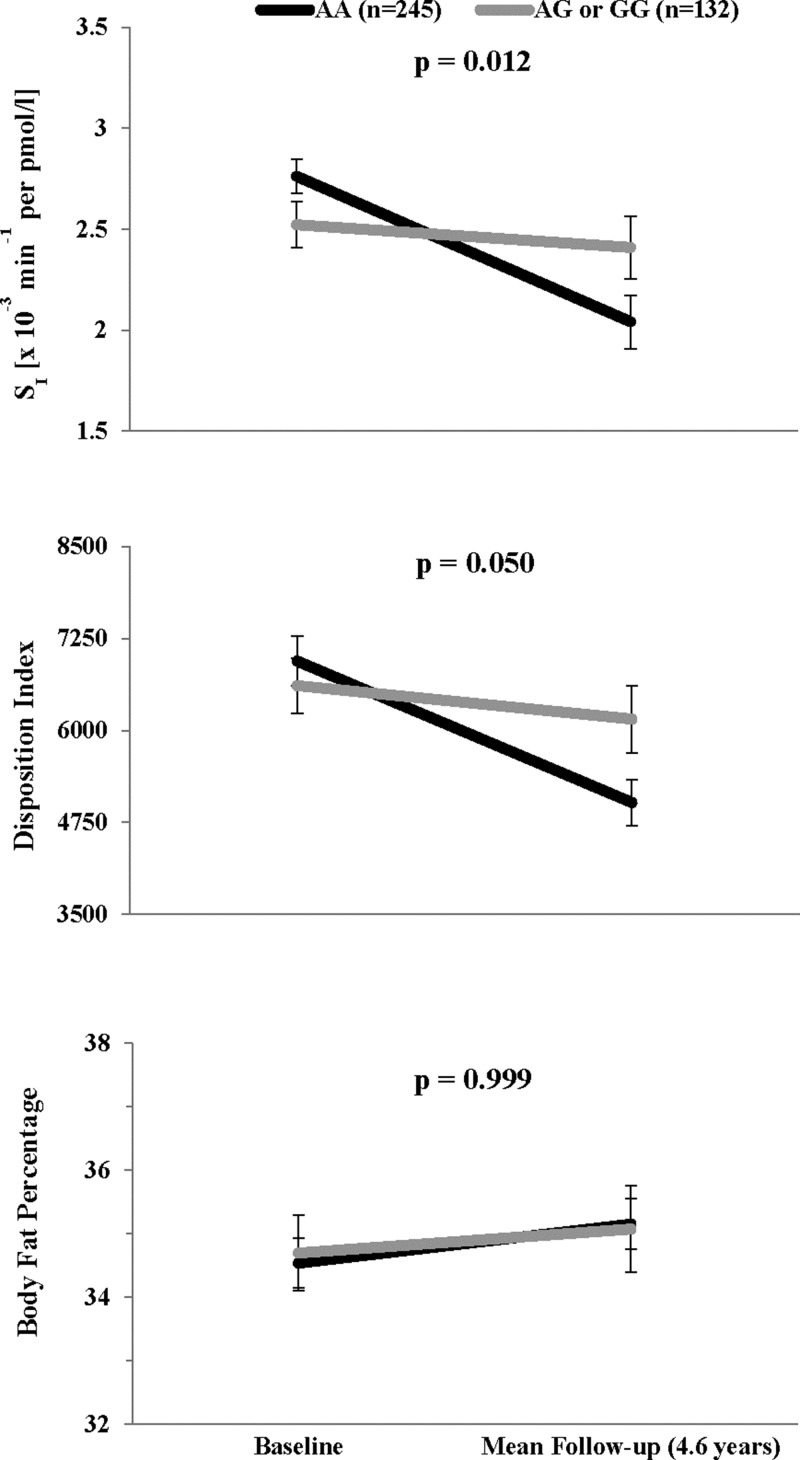
Figure 1.
Association between rs17793951 and changes in SI, DI, and body fat percentage over followup. Black lines indicate genotype AA; gray lines indicate genotypes AG or GG. Values shown for SI and DI at baseline and at mean follow-up time (4.6 y) are geomtric means with SEs computed by delta method, adjusted for age, sex, and body fat percentage. Values shown for body fat percentage are arithmetic means and SEs, adjusted for age and sex. P-values are Bonferroni corrected for 18 tag SNPs.

