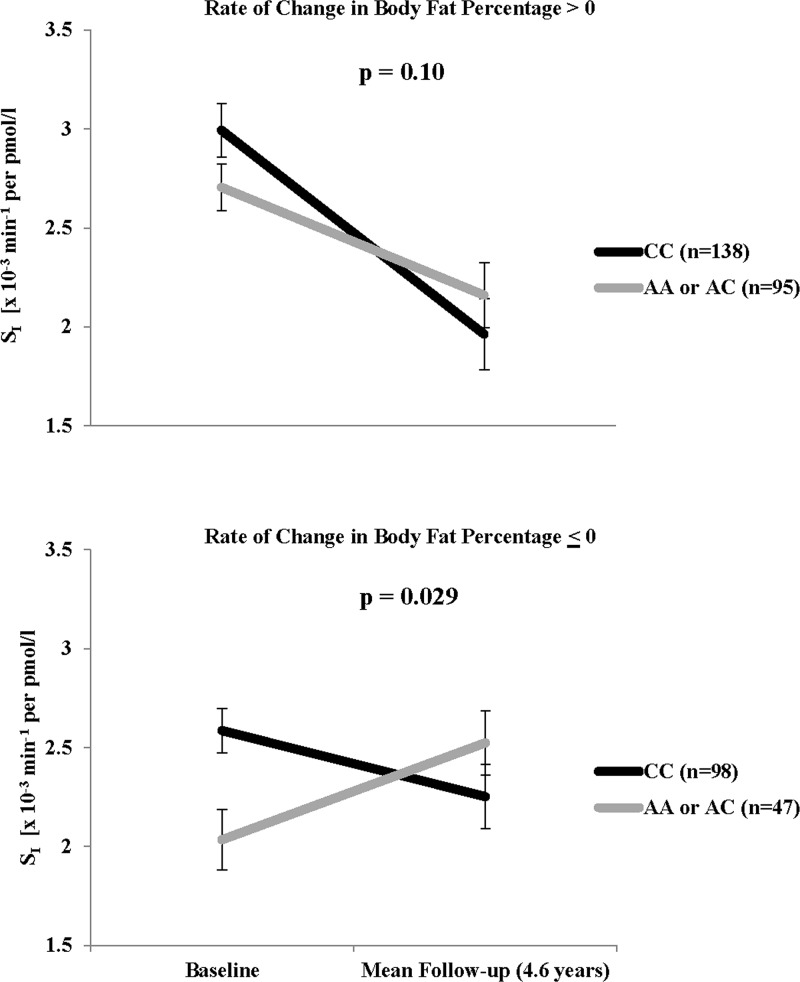
Figure 2.
Change in SI over followup for rs1175541, stratified by rate of change in body fat percentage. Black lines indicate genotype CC; gray lines indicate genotypes AA or AC. Values shown at baseline and at mean follow-up time (4.6 y) are geometric means and SEs, adjusted for age and sex. P-values are Bonferroni corrected for six interaction tests.

