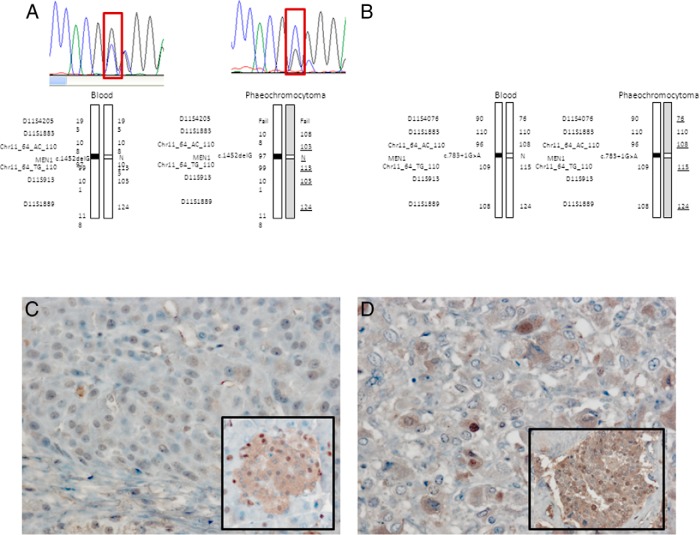
Figure 4.
A, LOH analysis at the MEN1 locus of the pheochromocytoma of patient 22 and patient 23 (B). Underlined microsatellite results identify markers that show a reduction in peak height in the pheochromocytoma sample compared with blood, indicating LOH but suggesting that some nontumoral tissue was also retained in the operated samples. C, Pheochromocytoma of patient 22 shows a loss of menin staining (inset: positive menin staining in mouse Langerhans islet). D, The menin staining of the pheochromocytoma of patient 23 shows some weakly positive staining nuclei (inset: positive menin staining in a sporadic pheochromocytoma used as a positive control).

