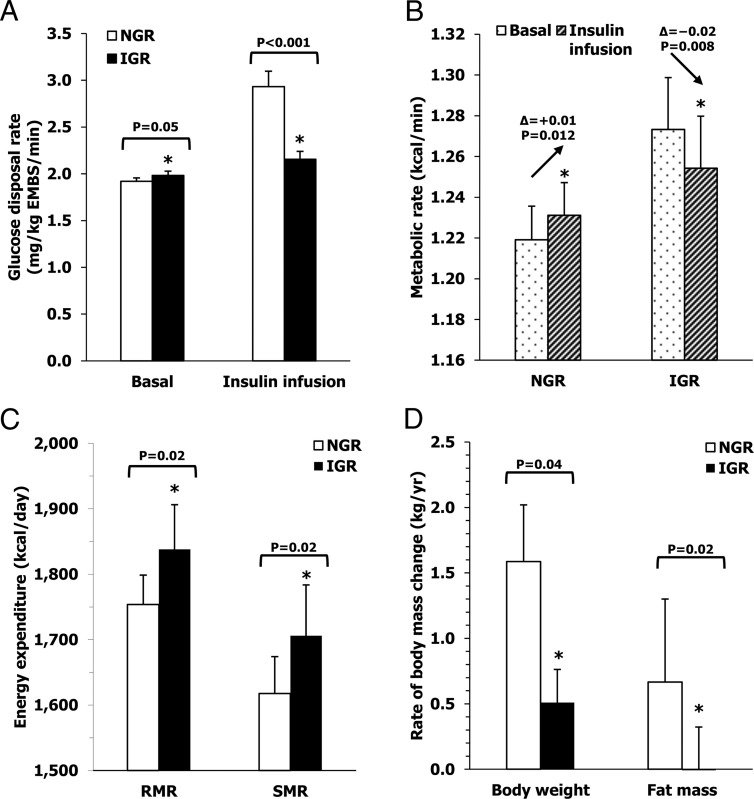
Figure 3.
Metabolic characteristics of subjects with NGR and IGR glucose regulation at baseline. Differences between subjects with NGR and IGR glucose regulation in glucose disposal (Panel A) and metabolic (Panel B) rates during clamp, resting, and sleeping EE (Panel C) all measured at the baseline visit and future rates of weight and fat mass changes (Panel D). Normal glucose regulation was defined as FPG <100 mg/dL and 2-h plasma glucose (2hPG) <140 mg/dL, while impaired glucose regulation was considered when FPG was in the range of 100–125 mg/dL and/or 2hPG was in the range of 140–199 mg/dL according to the American Diabetes Association diagnostic criteria (12).

