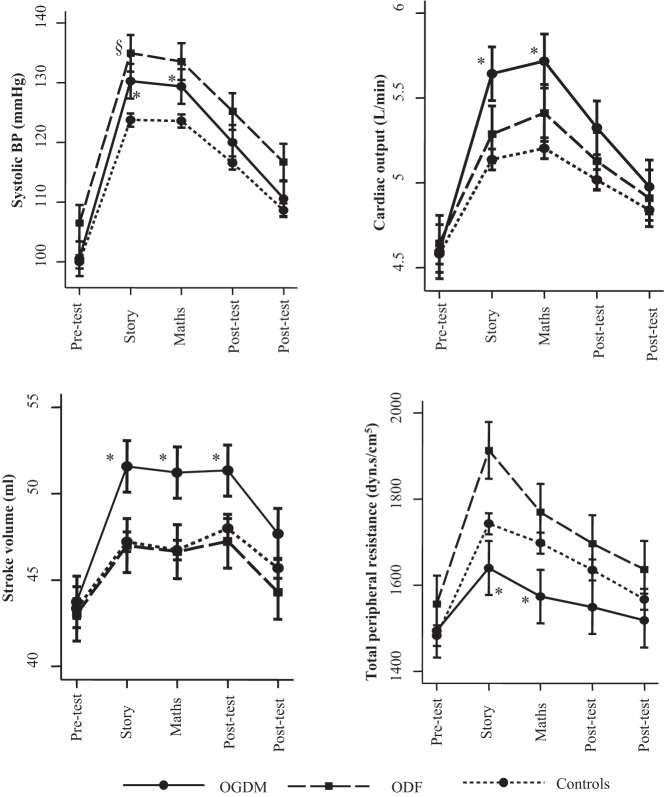
Figure 1.
Stress-induced cardiosympathetic response in OGDM, ODF, and controls. Values represent mean (95% CI) in OGDM, ODF, and controls at different timepoints relative to the stress test. Values were derived using linear mixed-model analysis, adjusting for age, sex, socioeconomic status, and current weight. *, P < .05 for the difference between OGDM and controls; §, P < .05 for the difference between ODF and controls.

