
Figure 5.
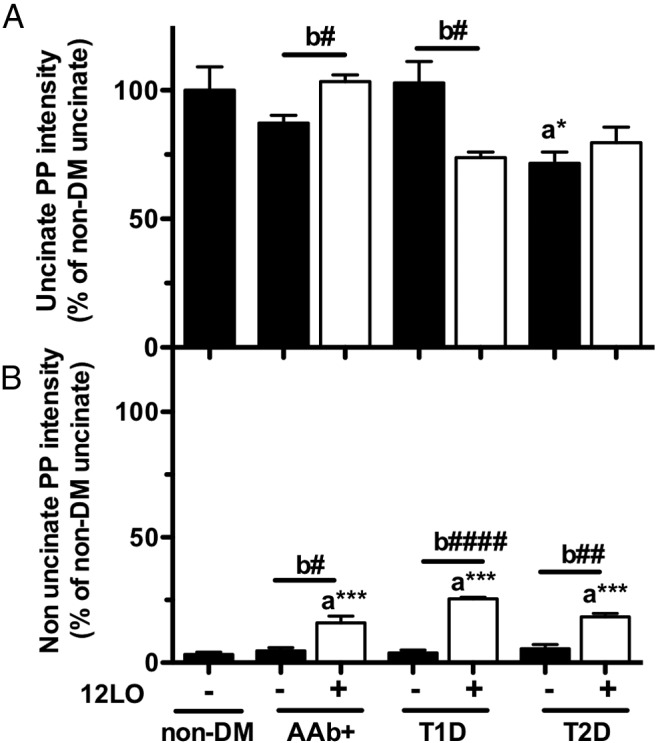
Quantification of PP intensity in islets from 12-LO+ and 12-LO− donors. The intensity of PP immunostaining within islets was quantified as in Materials and Methods in the uncinate (A) and nonuncinate (B) regions of the pancreas. Donors with AAb+, T1D, and T2D were separated based on the positivity of 12-LO in islets. We did not identify subjects with 12-LO+ cells in nondiabetic (non-DM) donors. Values are expressed as taking the average intensity of PP staining in the uncinate region of nondiabetic donors as 1. Data are means ± SEM (n = 3–4). Two statistical comparisons were performed: a, one-way ANOVA with Dunnett posttest in comparison with nondiabetic, *, P < .05; ***, P < .001; b, Student t tests between 12-LO+ and 12-LO− donors of each diabetic status, #, P < .05; ##, P < .001; ####, P < .0001.