Figure 1.
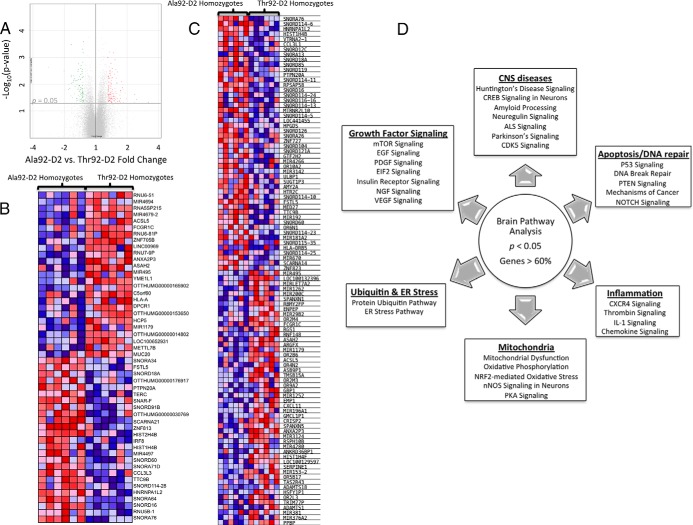
Microarray analysis of human brain from patients homozygous and heterozygous for the Thr92AlaD2 polymorphism. A, Volcano plot of expression data in the comparison of Ala92–D2 (n = 6) and Thr92–D2 (n = 6) homozygotes; highlighted genes are significant at a P value < .05 and a fold change > 1.3 (red) or < −1.3 (green). Generated in Affymetrix Transcriptome Analysis Console; (B) heat map of the 25 most enriched and 25 most down-regulated genes in human brain samples from Ala92–D2 and Thr92–D2 homozygotes by fold change from differential expression analysis; expression values are represented as colors (red: increased expression; blue decreased expression) with the degree of color saturation indicating degree of expression; distinct transcriptional trends are observed; (C) Heat map of the top 50 features exhibited by polymorphic homozygotes vs normal patients as calculated in the gene set enrichment analysis software; (D) Canonical pathways identified in analysis of all brain samples (n = 19) where individual pathways are grouped by overlap in function, each of these pathways was altered at P < .05 and with a ratio of genes affected within the pathway > 60%.

