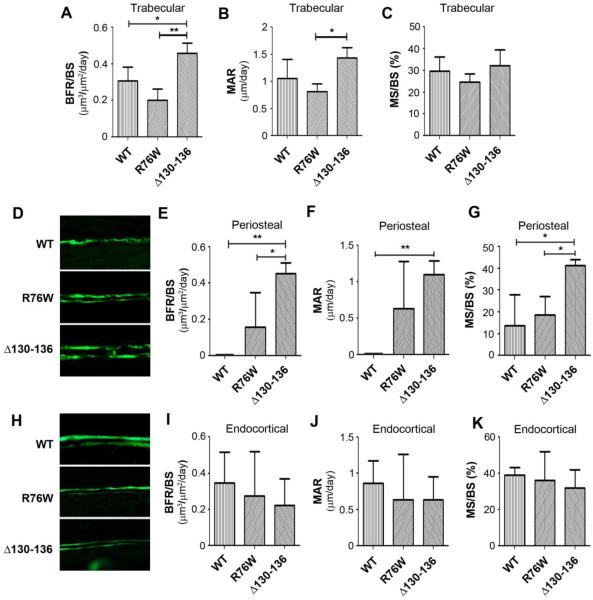
Figure 7. Increased bone formation rate in periosteal bone of Δ130-136 transgenic mice.
Four-month-old WT and transgenic mice were injected twice with calcein dye, tibial bones were isolated and plastic sections were prepared. The images of were shown. The dynamic bone histomorphometric parameters were measured in both trabecular (A-C), periosteal (D-G) and endocortical bones (H-K); the calcein double labeling of tibial midshaft cortical bone (D and H), bone formation rates (BFR/BS, A, E and I), mineral apposition rates (MAR, B, F and J) and ratio of mineral surface (MS) to bone surface (BS) (C, G and K). Data shown are mean ± SD. *, P < 0.05; **, P < 0.01. n = 3.

