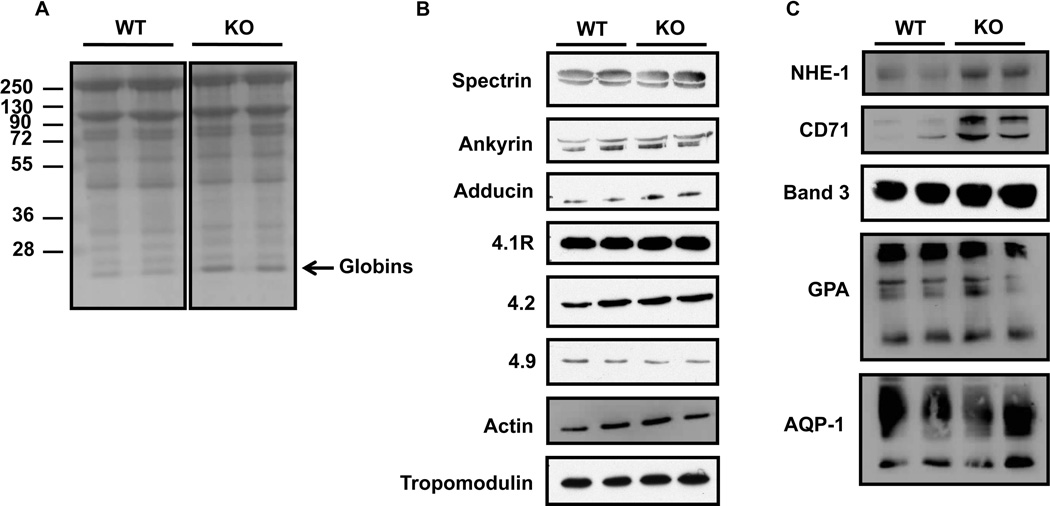
Figure 2. Expression levels of major red cell membrane proteins.
(A) Coomassie blue staining of SDS-PAGE gel of red cell membranes (ghosts) shows no major differences between wild type and Steap3 KO mice in terms of total protein contents. (B–C) Western blot analyses performed on ghosts from 2 wild type and 2 TSAP6/Steap3 KO mice for cytoskeleton proteins (B) or transmembrane proteins (C). Only NHE-1 and CD71 expression levels were increased in ghosts from KO animals.

