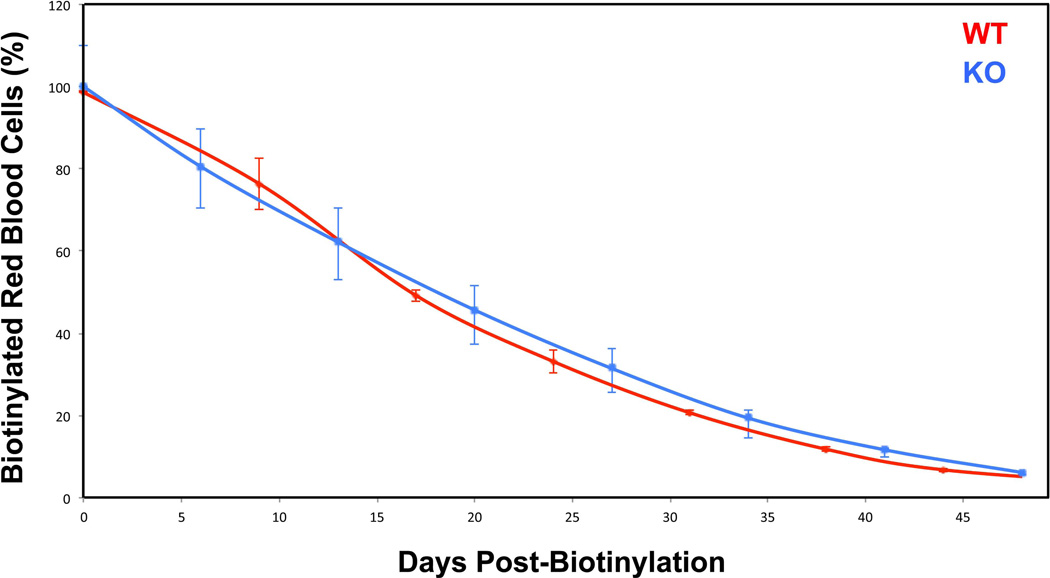
Figure 3. Red cell survival.
Red cell lifespan was followed after biotin injections at day 0, and measured as a decrease in the amount of biotinylated red blood cells over time. There was no significant difference between wild type and TSAP6/Steap3 knockout animals. Data presented X ± Standard Deviation, n=3 in each group. All animals were 4 months of age.

