Figure 2.
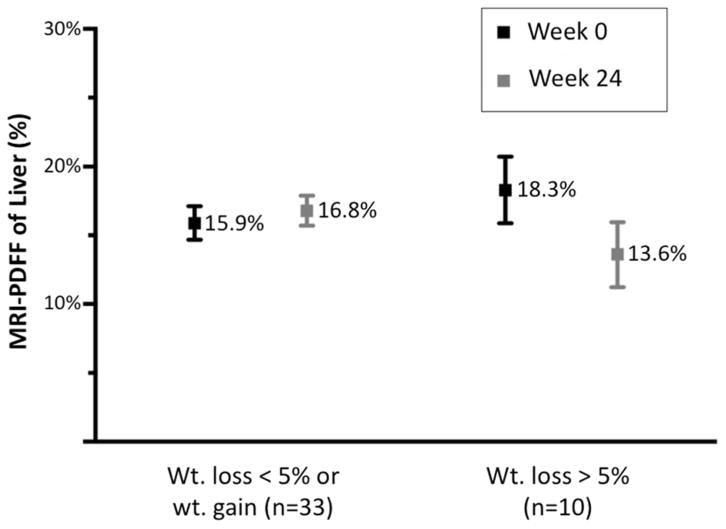
Figure 2A. Change in MRI-PDFF liver versus weight loss
Data are expressed as mean MRI-PDFF with standard error bars shown.
Abbreviations for tables: MRI, magnetic resonance imaging; PDFF, proton density fat fraction.
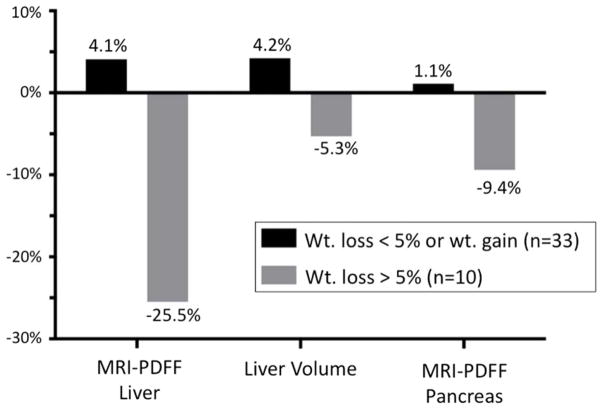
Figure 2B. Percent change in MRI-PDFF liver, liver volume and MRI-PDFF pancreas versus weight loss
Data are expressed as percent change from week 0 to week 24.
Abbreviations for tables: MRI, magnetic resonance imaging; PDFF, proton density fat fraction.


