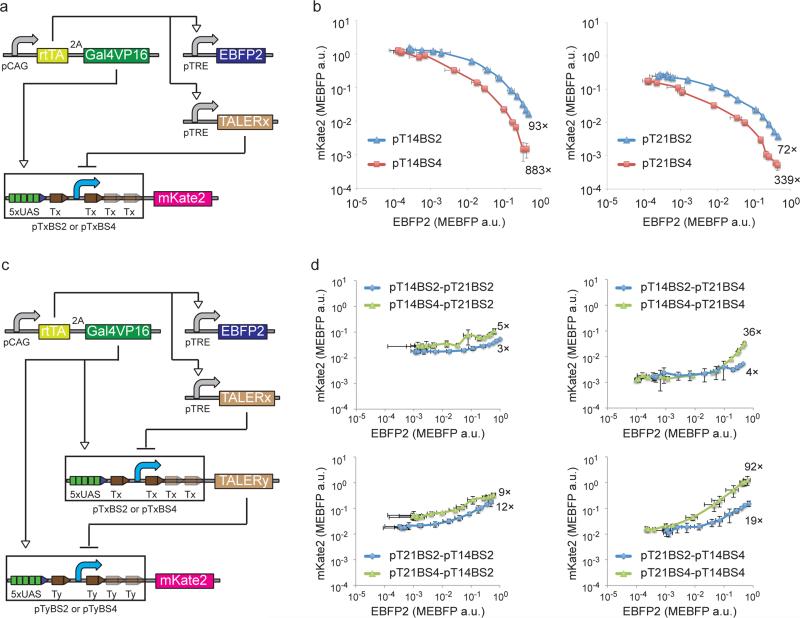
Figure 2. Design and construction of TALER cascade.
(a) Schematic representation of a circuit for measuring transfer curves. pTxBS2 and pTxBS4 are TALER promoters with two binding sites or four binding sites, respectively. (b) Circuit outputs for characterizing transfer curves indicated in (a) at varying Dox concentrations. Each data point shows mean ± SD from three independent replicates. (c) Schematic representation of a cascade circuit. For simplicity, pTxBS2 and pTxBS4 are depicted in the same diagram with two downstream binding sites in pTxBS4 promoter colored with reduced intensity. (d) Measured output from cascade circuit indicated in (c) at varying Dox concentrations. Each cascade is named by concatenating the name of the first TALER, ‘-‘, and the name of the second TALER. Each data point shows mean ± SD from three independent replicates.

