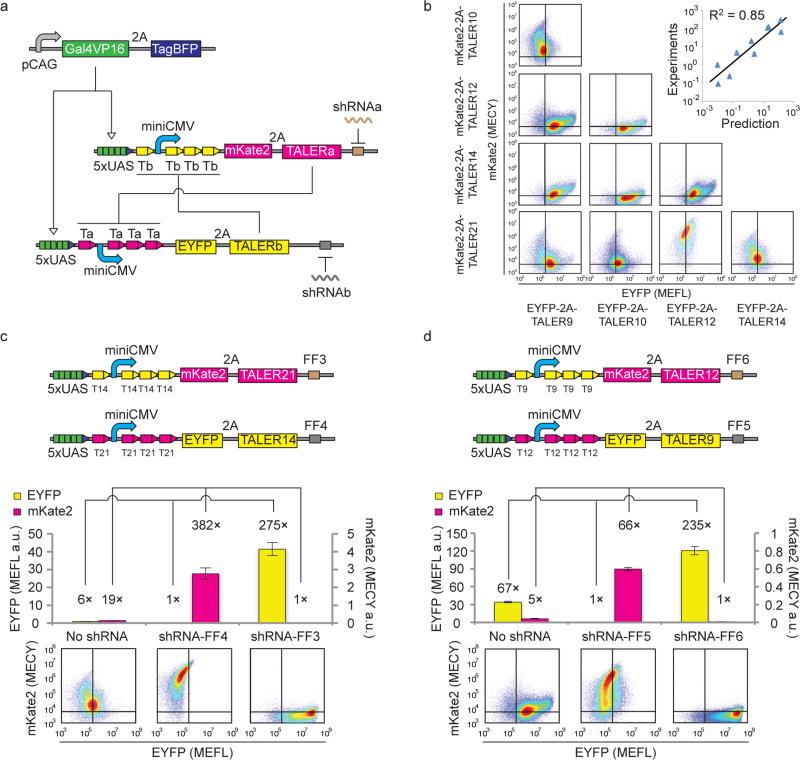
Figure 3. Design and construction of TALER sensory switches.
(a) Schematics of TALER switching circuits. Each TALER level is monitored by 2A-linked mKate2 or EYFP fluorescence. shRNAs are represented by wiggly lines, and shRNA targets are shown as blocks in brown or grey color. (b) Indicated TALER switches were co-transfected into HEK293 cells. Representative flow cytometry scatter plots measured 48 h post-transfection are shown in a matrix layout, where each row shows the same mKate2-linked TALER used in transfection experiments and each column represents the same EYFP-linked TALER used in transfection experiments. Correlation of the ratio of EYFP to mKate2 is shown in the top-right graph. Each data point shows mean ± SD from three independent replicates. (c) and (d) Setting the states of TALER21-TALER14 switches (c) or TALER21-TALER9 switches (d) by shRNAs. The upper panels represent schematics of TALER switches. Each bar shows mean ± SD of EYFP or mKate2 from three independent replicates. The lower panel represents representative flow cytometry scatter plots measured 48 h post-transfection.

