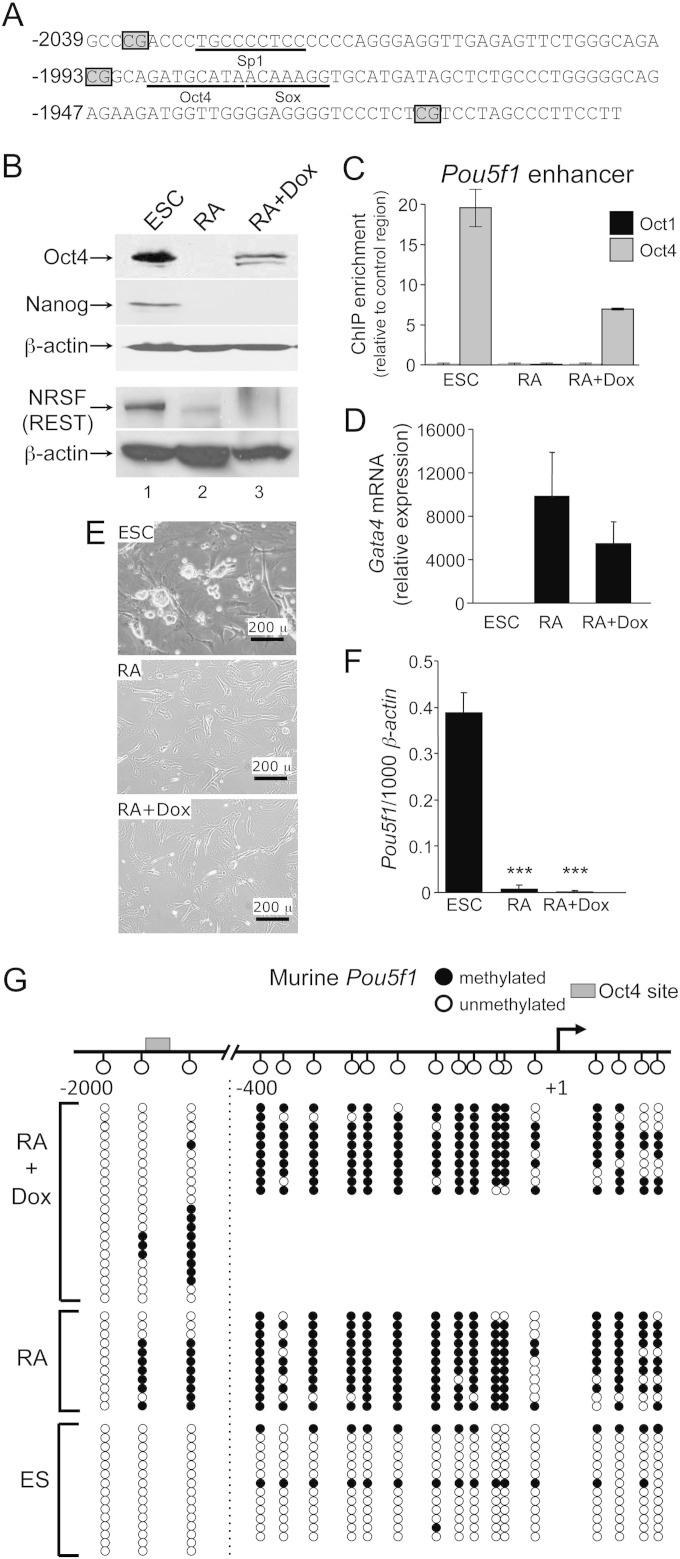
FIG 1.
ESCs can be differentiated normally with low-level Oct4. (A) Sequence of the murine Pou5f1 enhancer region. CpG positions are boxed. Known transcription factor binding sites are underlined. (B) Oct4 Western blots of lysates from tetON-Oct4 ESCs (21) and differentiated ESCs cultured for 16 days in medium lacking LIF and containing RA, with or without doxycycline. Experiments were performed in the absence and presence of doxycycline (Dox). Oct4, Nanog, and REST protein expression levels were evaluated. β-Actin was used as a loading control. (C) Oct1 and Oct4 ChIP enrichment at the Pou5f1 distal enhancer. Differentiation was for 12 days. Values represent averages of triplicate experiments. Error bars depict the standard deviations of the mean. (D) Gata4 mRNA expression was determined by qRT-PCR under similar conditions to (C). mRNA levels were normalized to β-actin and changes in expression are represented as the fold change (n = 3). Error bars depict the standard deviations. (E) Phase microscopy images of cultured tetON-Oct4 ESCs. The upper left panel shows cells propagated in ESC culture medium. The upper right panel shows cells differentiated for 16 days in medium lacking LIF and containing RA. The bottom panel shows cells also cultured in doxycycline. Images were taken using an Olympus IX51 inverted microscope at ×40 magnification with a Lumenera Infinity 2 camera. (F) Pou5f1 mRNA expression levels as determined by qRT-PCR using primers specific for the endogenous allele (n = 3). Error bars depict the standard deviations. (G) Bisulfite sequencing analysis of the murine Pou5f1 enhancer and promoter regions. A schematic is shown at the top. The Oct4 binding site is boxed. Filled circles indicate DNA methylation, and open circles indicate unmethylated DNA for a particular sequenced clone. Sequence reads on either side of dashed line were separately amplified, miniprepped, and sequenced.

