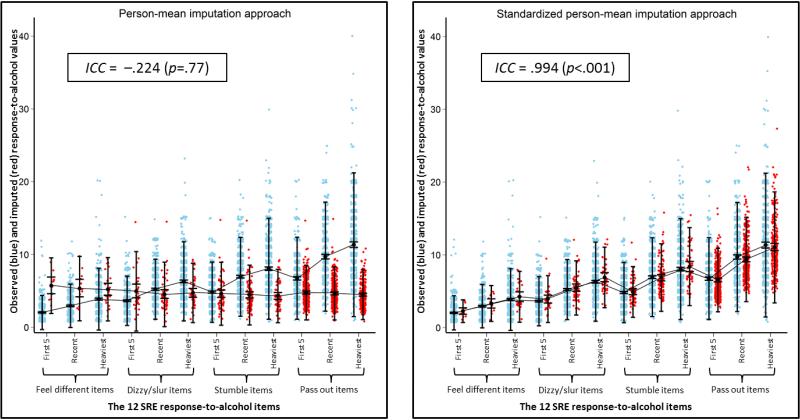
Figure 1.
Characterizing the item-level imputation bias of person-mean imputation: Contrasting distributions of response to alcohol (y-axis) observed scores (blue points) versus imputed scores (red points) across the 12 SRE items (x-axis), separately for person-mean imputation (left) and standardized person-mean imputation (right). Black dots (with connecting lines) show means, wide bars show 95% mean confidence limits, and narrow bars encompass scores within two standard deviations of the mean. Reported intra-class correlations (ICCs; equation (3,1) from Shrout and Fleiss, 1979) assess agreement between observed value means and imputed value means when treating the 12 SRE items as a sample of 12 cases. For x-axis labels that distinguish among the 12 SRE items, “First 5” = during the first five lifetime drinking occasions, “Recent” = during the most recent three-month drinking period, and “Heaviest” = during the period of heaviest lifetime drinking.

