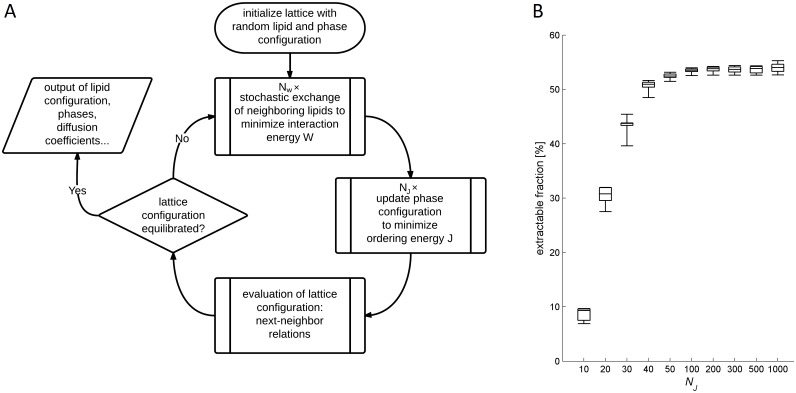
Figure 1. Algorithm scheme and influence of algorithm parameters.
(A) Flow chart illustrating the 2-step minimization procedure applied to simulate the lattice dynamics and to calculate the ordering states of the lipids. (B) Box-plot depicting the influence of the control parameters NJ (counting the number of updates of the ordering state carried out per lipid to minimize the ordering energy J) and NW (counting the number of pairwise lipid switches per lattice site in the minimization of the interaction energy W) on the phase separation of the model membrane. The parameter NJ adopted different values between 10 and 1000 represented by the different boxes. For each value of NJ the parameter NW adopted the values 1, 5, 10, 20, 50 and 100. For all combinations of NJ and NW the percentage of the Ld phase (= extractable membrane fraction) was computed. The edges of the boxes indicate the lower and upper quartile, the horizontal bar inside indicates the median and the whiskers indicate the full range of the calculated values at fixed NJ and NW varied.

