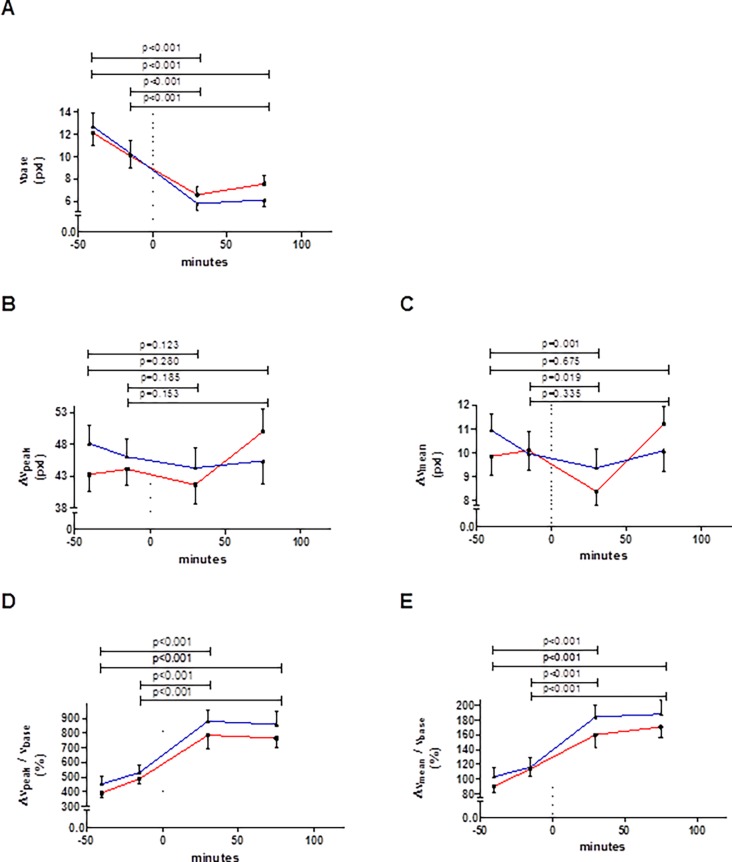
Figure 4. Changes in the baseline blood flow velocity (A), and the absolute changes in peak (B) and mean (C) blood flow velocity and relative changes in peak (D) and mean (E) blood flow velocity with glucose loading, as observed during flow-mediated dilation assessments at the 4 time-points indicated.
Glucose was ingested at time-point 0 minutes (dashed vertical line). Red line: session 1, blue line: session 2; whiskers indicate standard error. Data did not differ between sessions at any corresponding time-point (all p-values ≥ 0.071, n = 22). The p-values on top of the graphs refer to differences between pre and post glucose intake (of the mean of both sessions). Abbreviations as defined in Table 1.

