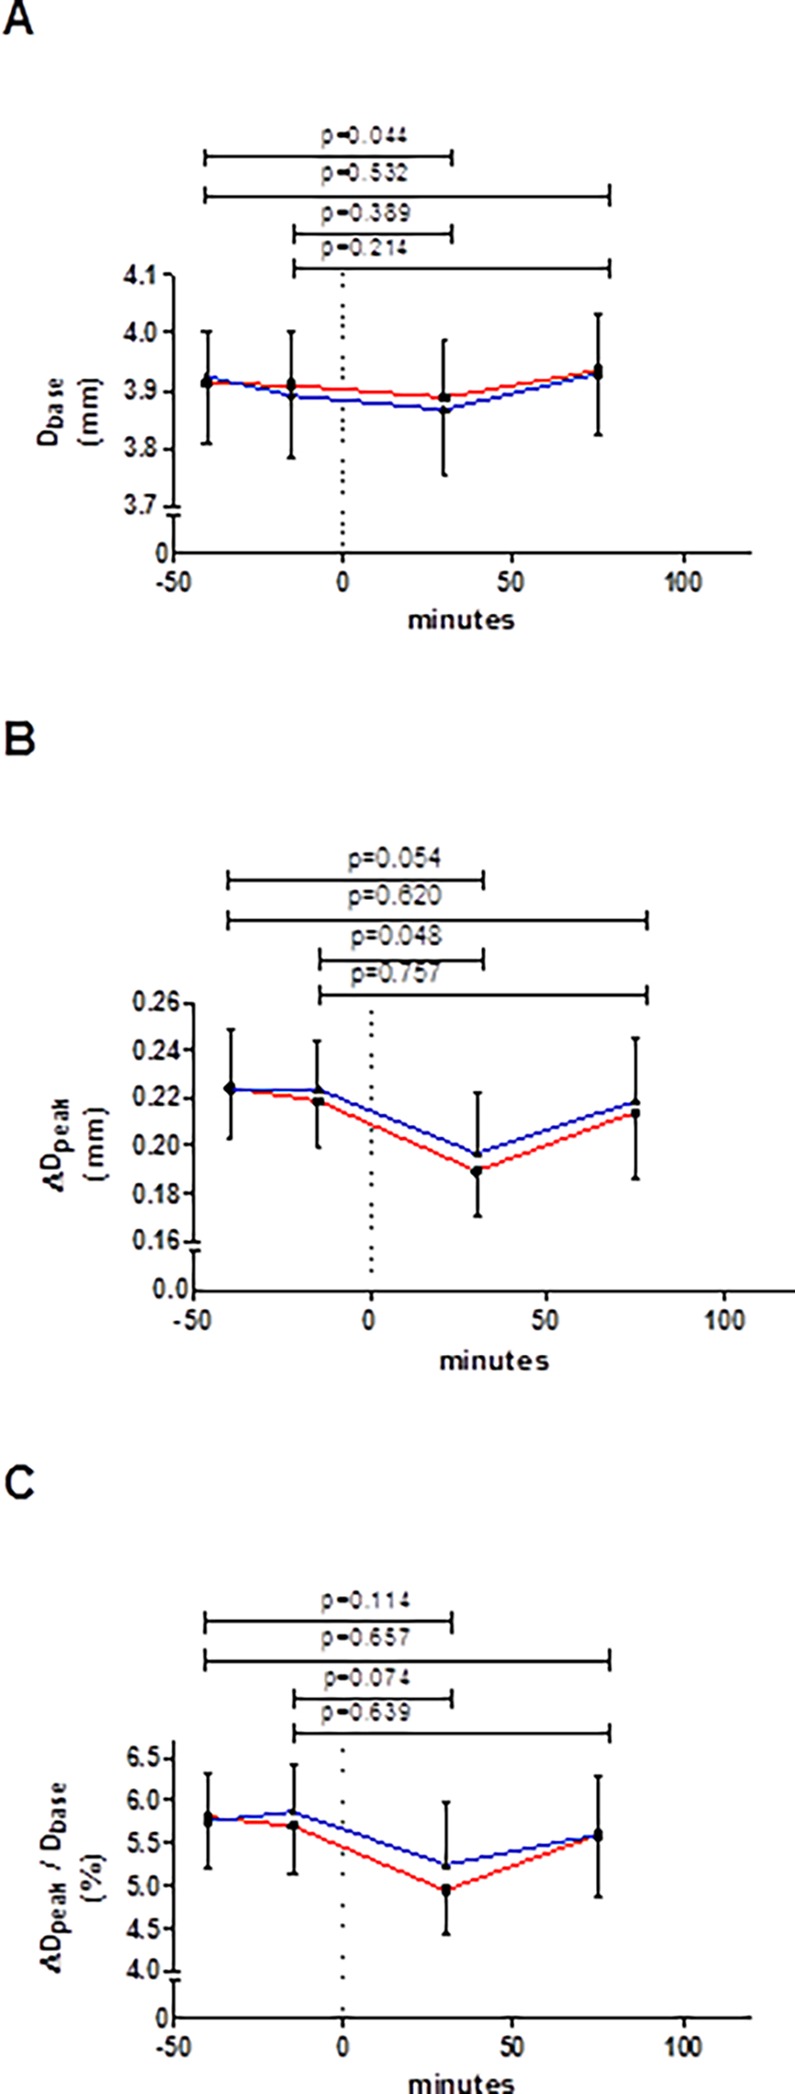
Figure 5. Changes in (A) baseline diameter and (B) the absolute and (C) the relative (i.e. %FMD) peak changes in brachial artery diameter.

Glucose was ingested at time-point 0 minutes (dashed vertical line). Red line represents session 1 and blue line session 2; whiskers indicate standard error. Data did not differ between sessions at any corresponding time-point (all p-values ≥ 0.568, n = 22). The p-values on top of the graphs refer to differences between pre and post glucose intake (of the mean of both sessions). Abbreviations as defined in Table 1.
