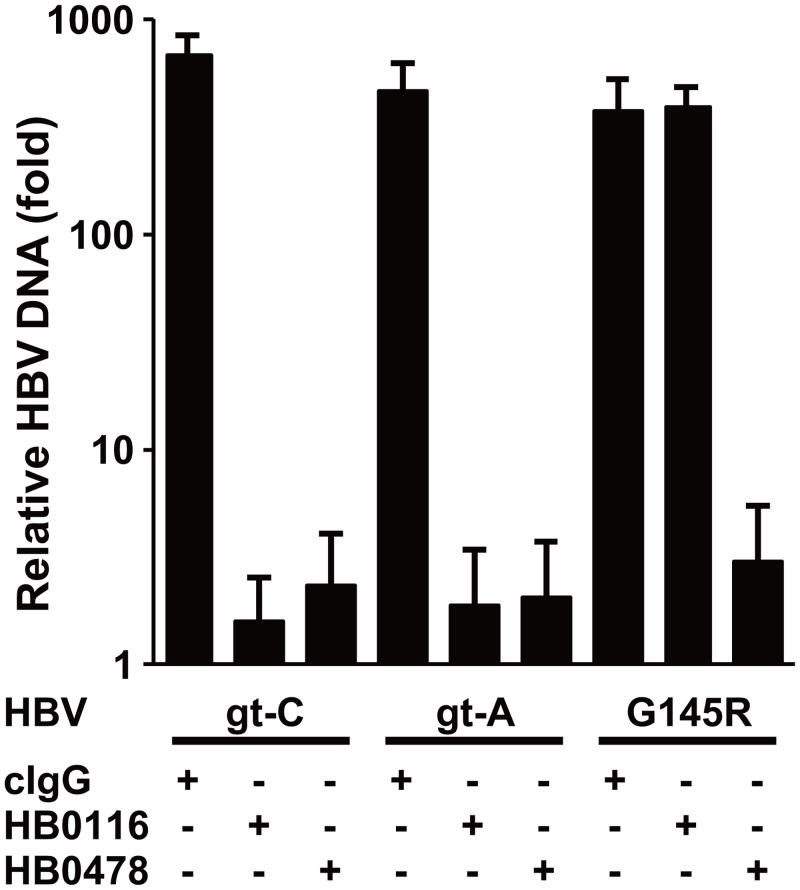
Fig 2. Relative HBV DNA concentrations in the total DNA extracted from HepaRG cells at 7 days after HBV infection.
The Y-axis depicts the relative HBV DNA concentrations in the cells, with the concentrations on day 1 set at 1. Mean ± SD of three independent experiments are shown. cIgG, control human monoclonal IgG.

