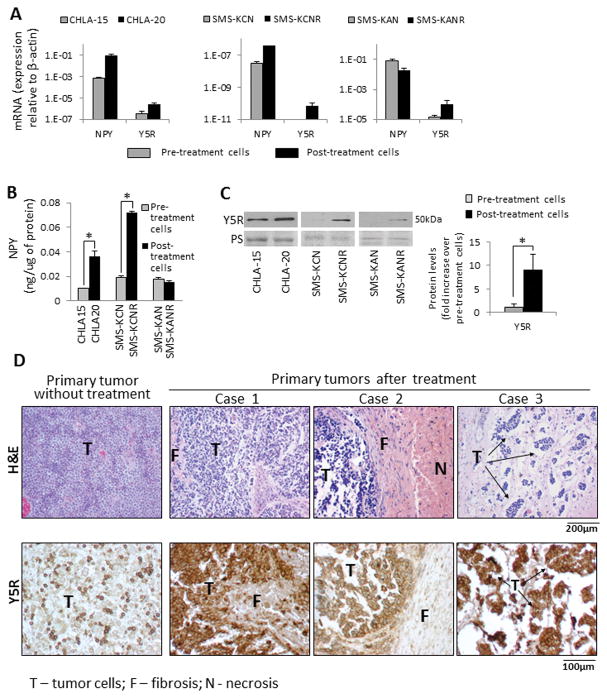
Figure 7. NPY system is up-regulated in cells and tissues from chemotherapy-treated tumors.
A. mRNA levels of NPY and Y5R were measured by real-time RT-PCR and compared within pairs of cells derived from the same patients before and after therapy. B. NPY levels in the above panel of cells were measured by ELISA. C. Protein levels of Y5R in pre- and post-treatment cells were detected by Western blot and quantified by densitometry. PS – unspecific protein staining. D. Y5R immunostaining of human NB tissues derived from primary tumors at diagnosis (representative images) and after chemotherapy (3 independent cases).

