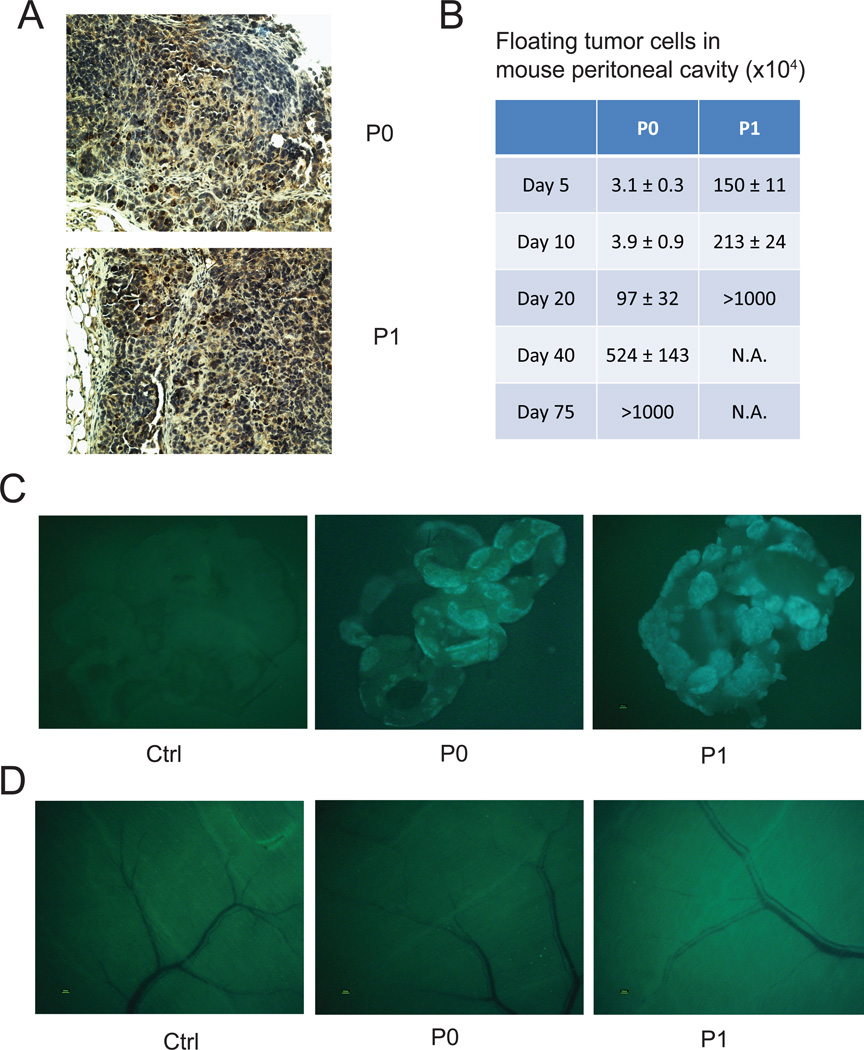
Figure 2. ID8-P1 cells survived longer than ID8-P0 cells in the mouse peritoneal cavity.
5×10⁶ ID8-P0 or ID8-P1 cells were i.p. injected into C57BL6 mice. At designated time points after injection, mice were sacrificed. A. Representative images of Ki67 staining of ID8-P0 and ID8-P1 tumors. B. Fluorescent tumor cells in peritoneal washes were counted (n=3 per time point per group). C. Fluorescent tumor cells that attached to peritoneal organs were detected (n=3 per time point per group). Representative images of tumor metastases on omentum of the mice 5 days after injection. D. Representative images of tumor metastasis on the peritoneal wall of the mice 5 days after injection.

