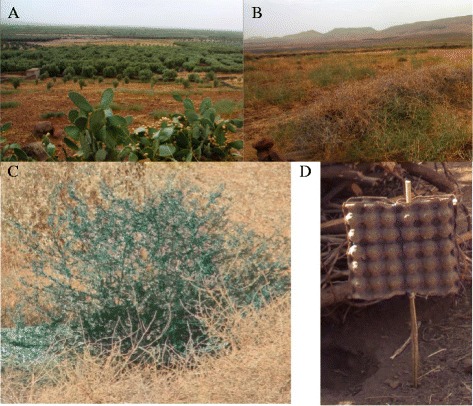
Figure 1.

Depiction of the sugar rich and sugar poor ATSB evaluation sites. A) sugar rich site with flowering cactus; B) sugar poor site with only fallow fields and stone walls, C) ATSB dyed vegetation, and D) ATSB bait station design using readily available egg cartons.
