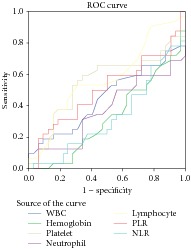
Table 2.
Model selection with ROC curve estimation in regression analysis for brucellosis.
| Variable(s) | P value | 95% confidence interval | |
|---|---|---|---|
| Lower bound | Upper bound | ||
| WBC | 0,50 | 0,30 | 0,59 |
| Hemoglobin | 0,01 | 0,19 | 0,45 |
| Platelet | 0,48 | 0,40 | 0,69 |
| Neutrophil | 0,07 | 0,23 | 0,51 |
| Lymphocyte | 0,31 | 0,43 | 0,71 |
| PLR | 0,95 | 0,35 | 0,64 |
| NLR | 0,01 | 0,19 | 0,46 |
|
| |||
| Diagonal segments are produced by ties | |||
|
| |||

| |||
