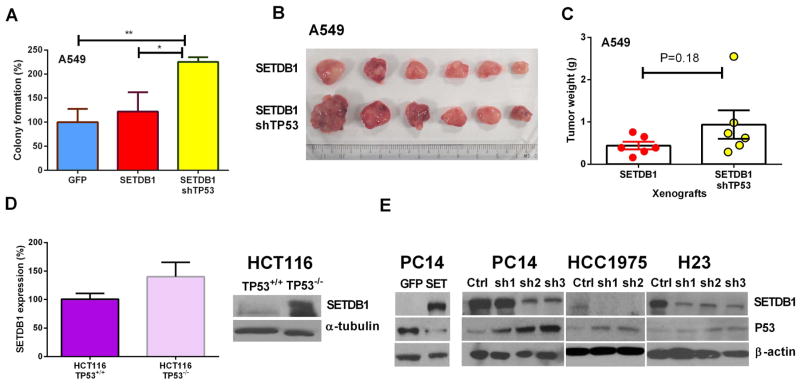
Fig. 4. Inverse correlation between the protein levels of P53 and SETDB1.
A. Silencing TP53 enhanced the colony formation of A549 cells (wild type P53) having forced expression of SETDB1. B. A549 NSCLC cells were either stably overexpressing SETDB1 (upper row) or stably overexpressing SETDB1 and silencing TP53 (lower row). These two cohorts of cells (5 × 10⁶) were injected into the opposite flanks of nude mice. Tumors were photographed (Panel B) and weighed (Panel C) on day 35 after initiation of the study. D. SETDB1 expression levels in the HCT116 TP53+/+ and TP53−/− HCT116 cells. Left panel, SETDB1 mRNA expression; right panel, western blot of the same cells. E. Protein levels (western blot) of P53 and SETDB1 in NSCLC cells (PC14, HCC1975, H23) with either stable overexpression or silencing of SETDB1.

