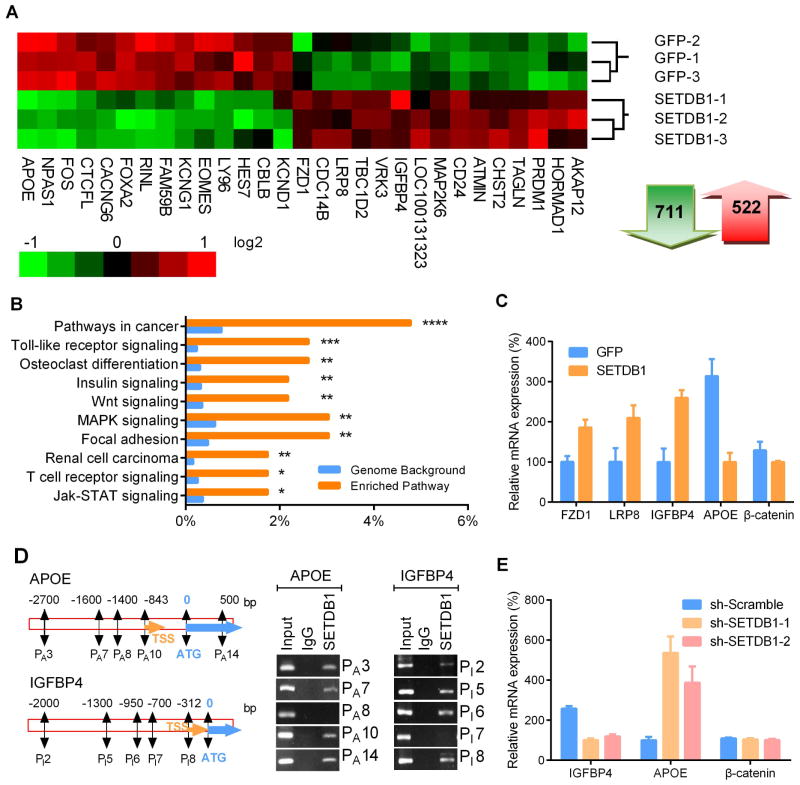
Fig. 5. Altered gene expression in NSCLC cells with forced expression of SETDB1.
A. RNA array data was transformed into heat-map of gene expression in H1299 NSCLC cells stably expressing SETDB1. Green and red represents down-regulation and up-regulation of gene expression, respectively. Total 711 genes were down-regulated and 522 genes were upregulated after overexpression of SETDB1. B. Pathway enrichment analysis between SETDB1 and control GFP overexpressing H1299 cells using the KEGG database. Top 10 significantly enriched pathways are presented in the graph (*, P≤0.05; **, P ≤ 0.01; ***, P ≤ 0.001; ****, P ≤ 0.0001). C. RT-PCR validation of expression of genes related to the WNT signaling pathway in SETDB1 overexpressing H1299 cells. Relative mRNA amounts were normalized to β-actin. D. Recruitment of SETDB1 to the promoter region of APOE and IGFBP4 was examined by ChIP. Nucleotide segments 2 ~ 2.3 kb upstream and 600 ~ 1000 bp downstream from the starting site (ATG) were divided into 14 (APOE) and 10 (IGFBP4) regions, enrichment of each fragment (250~300 bp) were examined by PCR. Enrichment occurred in the promoter regions of PA 3, PA 7, PA 10 and PA 14 of the APOE promoter (left panel) and regions of PI 2, PI 5, PI 6 and PI 8 of the IGFBP4 promoter (right panel). TSS, transcriptional start site; ATG, protein start codon. Negative results of promoter regions PA 8 (APOE) and PI 7 (IGFBP4) were shown as controls for respective genes. E. mRNA levels of IGFBP4, APOE and β-catenin in SETDB1 silenced H1299 cells. Relative mRNA amounts were normalized with β-actin. Error bars indicate SD (n = 4).

