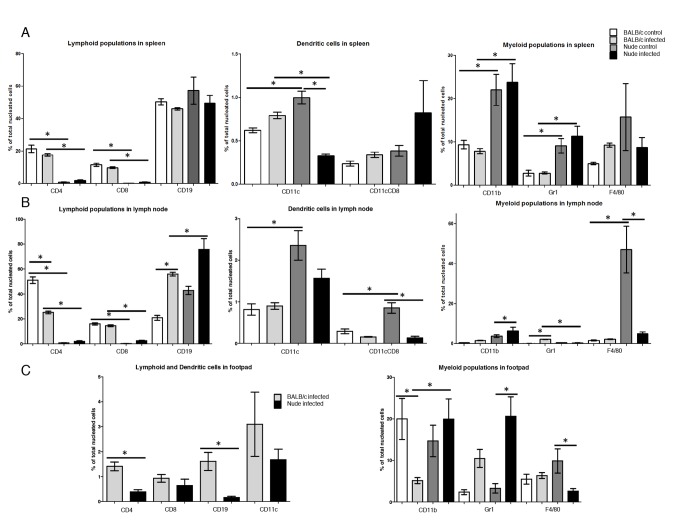
Fig 2. Comparison of lymphoid, myeloid and dendritic cell populations in spleens (A), popliteal lymph nodes (B) and footpads (C) of infected and non infected BALB/c and BALB/c nude mice by flow cytometry.
Results of one experiment with 3 animals of each for control condition and four of each for infection. Statistical analyses by ANOVA followed by Tukey´s multiple comparison test for all comparisons except for lymphoid and dendritic cells in footpads (Fig. 2C left), where t test was employed. * = p<0.05

