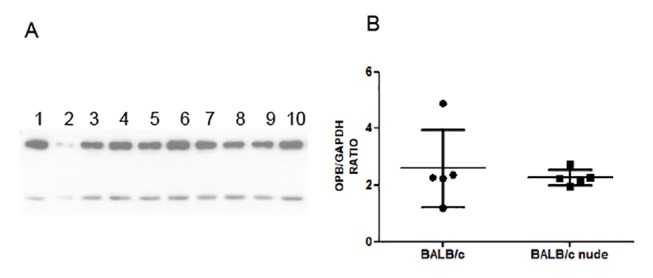
Fig 4. Western blot for OPB expression in 5 pairs of lesion derived amastigotes from BALB/c and BALB/c nude mice.

A. Western blot image showing OPB (upper band) and GAPDH (lower band) in soluble extracts from BALB/c derived amastigotes (1–5) and BALB/c nude derived amastigotes (6–10). B. Expression of OPB relative to GAPDH in the 10 samples. Statistical analysis by t-test. * = p<0.05
