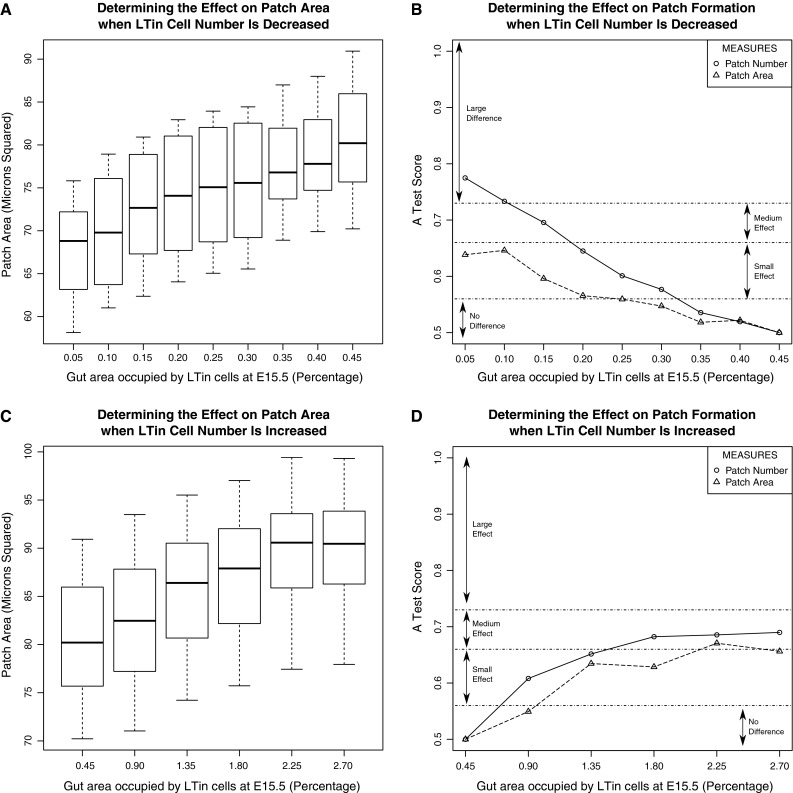
Fig. 2.

Using our PP organogenesis simulation to assess the assumption that the number of cells in the simulation at E15.5 should match the number observed experimentally. Top row: Investigating a decrease in LTin cell number at E15.5. Upper/lower markers denote the maximum and minimum value in the distribution respectively. Bottom row: Investigating an increase in LTin cell number at E15.5. Simulations were run 300 times for each LTin cell parameter value and median values calculated as described in the method. The left column of the figure contains boxplots of the patch area for each value the parameter has been assigned. The right column contains the result of a comparison between patch characteristics observed at baseline values and those observed when the parameter is perturbed, using the Vargha-Delaney A-Test (Vargha and Delaney 2000) as described in the method
