Fig. 3.

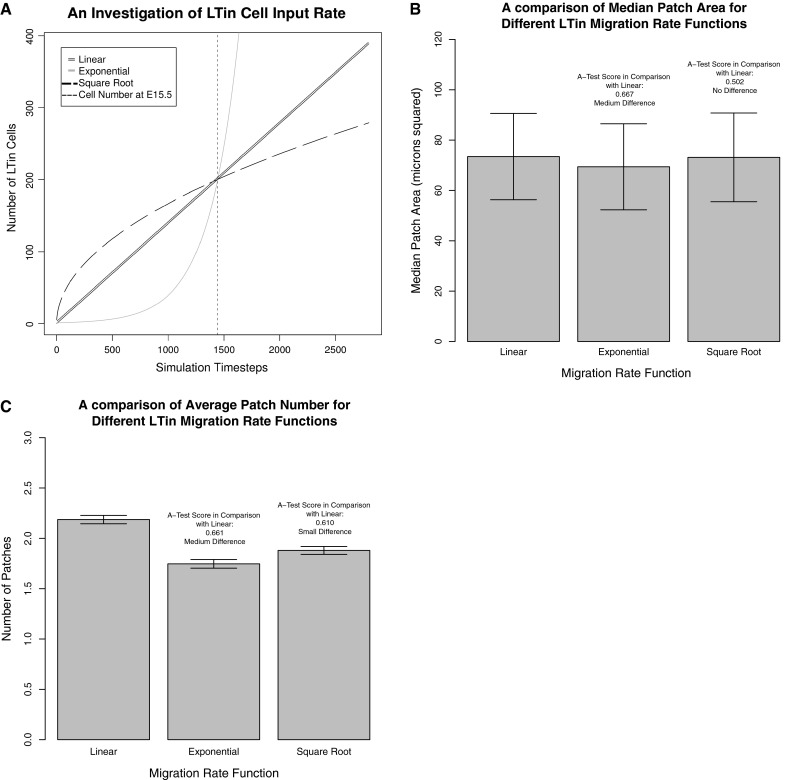
Investigating LTin cell migration rate using our PP organogenesis simulation, by changing the assumed input rate function as described in the Sect. 3. a Flow cytometry data has been used to estimate the number of LTin cells present in the gut at E15.5 (small dotted line). With cell counts at other timepoints unavailable, the simulator assumes the linear input rate that meets the number of LTin cells observed experimentally, and continues at the same trajectory until E17.5 (double line). Alternative migration rates examined here were (i) Exponential (gray line) and (ii) Square root (black broken line) functions. These three lines converge at E15.5 to match the number of cells observed in flow cytometry. 300 simulation runs were performed for each migration rate function and medians calculated as described in the method. b A comparison of the median PP area observed for each input rate function. c A comparison of the median number of PP for each migration rate function. Results for the exponential and square root functions have been contrasted to the linear input rate using the Vargha-Delaney A-Test (Vargha and Delaney 2000), the result of which is noted on the plot. Error bars: Minimum and maximum median patch area
