Figure 3.

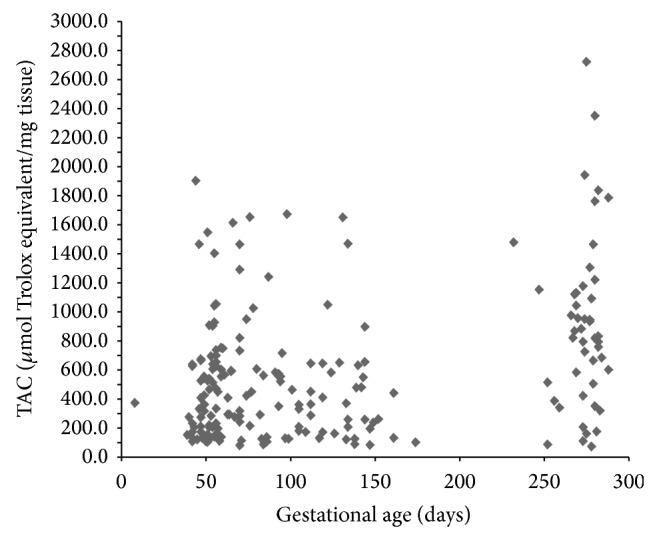
TAC: total antioxidant capacity. The scatter plot showing an upward trend in placental TAC levels with an increase in gestational age in days.

TAC: total antioxidant capacity. The scatter plot showing an upward trend in placental TAC levels with an increase in gestational age in days.