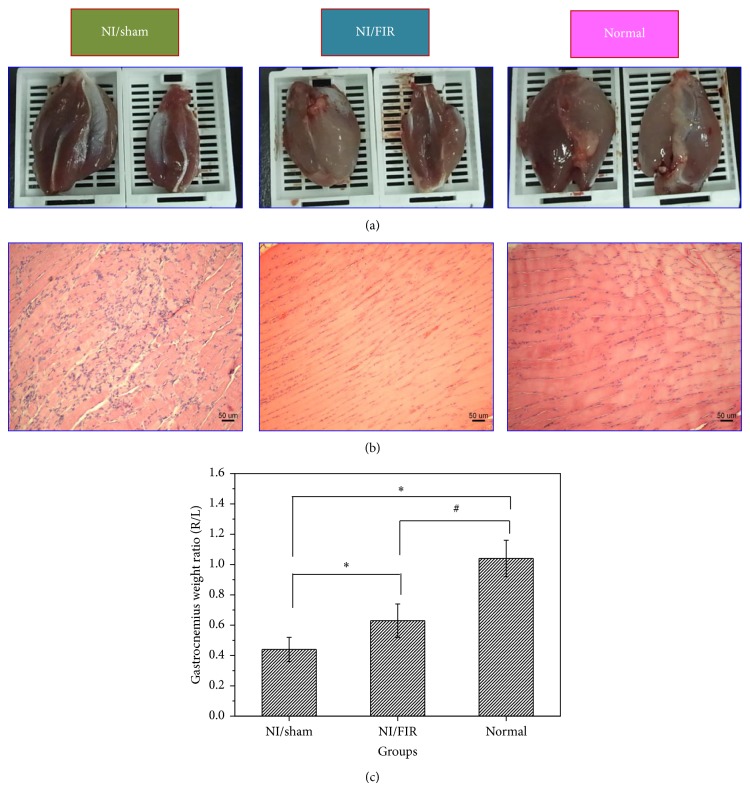
Figure 3.
(a) Photographs of muscle atrophy at Week 8 following end-to-end neurorrhaphy (experimental muscles are on the right, and contralateral muscles are on the left); (b) light micrographs of transverse-sectioned gastrocnemius muscle with H&E staining; (c) gastrocnemius muscle weight ratios (right/left, R/L) in all groups at 8 weeks after surgery. ∗ significantly greater than the NI/sham group (P < 0.05); # significantly greater than the NI/FIR group (P < 0.05).

