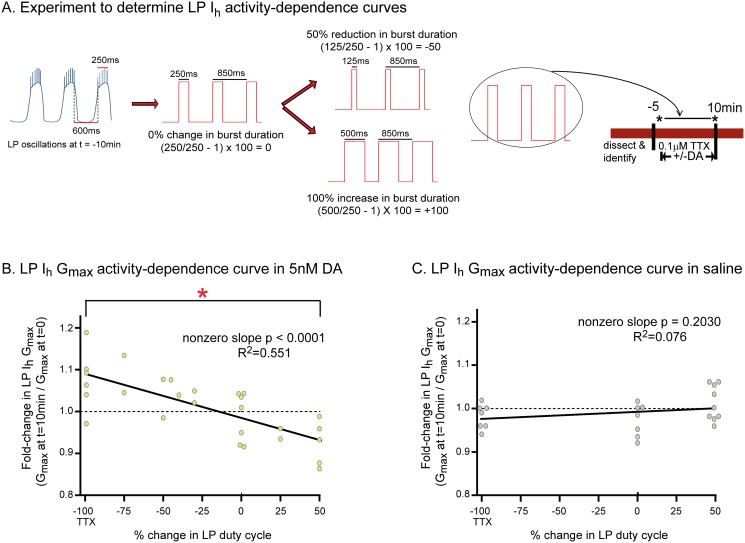
Fig 3. Tonic 5nM DA endows LP Ih with activity dependence.
(A) Experimental protocol. Activity was recorded with extracellular electrodes throughout the experiment. Measures of activity were obtained at t = -10min. The diagram shows how these measures were used in conjunction with TEVC to create a recurring voltage step that mimicked slow oscillatory activity at t = -10min. A change in LP burst duration was created by varying the length of the depolarizing step, as shown. Note that cycle period was maintained regardless of the change in burst duration; i.e., a change in burst duration was accompanied by a corresponding change in interburst duration. Duty cycle is defined as burst duration/cycle period; thus, our manipulations altered burst duration and duty cycle to the same extent. At t = -5min TTX was added to the superfusate. At t = 0, LP Ih was measured with TEVC (black asterisk). Afterward, from t = 0 to 10min, 5nM DA was (B) or was not (C) added to the superfusate and TEVC was used to either hold the cell at its initial membrane potential in TTX (-100), or implement a recurrent voltage step (-75 to +50). At t = 10min, LP Ih was again measured with TEVC (black asterisk). The experiment terminated at this point and a single preparation was not used further for additional experiments. (B-C) LP I h activity dependence curves. For every experiment in 5nM DA (B) or saline (C), the fold-change in LP Ih Gmax at t = 10min (i.e. Gmax at t = 10÷Gmax at t = 0) was plotted against the % change in LP duty cycle and a linear regression was used to fit the data. Each data point on the plots represents one experiment and 51 animals were used to obtain the data shown in the plots; -100 on the x-axis represents experiments in TTX without a recurring step, i.e., complete activity blockade. Each line represents a linear regression analysis and the resulting R2 and p values are shown on the graph. Red asterisk indicates that LP Ih Gmax was significantly different at-100 and +50 in the presence but not absence of 5nM DA as determined using one-way ANOVAs with Tukey’s multiple comparisons post hoc tests to analyze the-100, 0, and +50 groups (5nM DA: F(2,17) = 8.464; p = 0.0035; saline: F(2,22) = 2.326; p = 0.1236).

