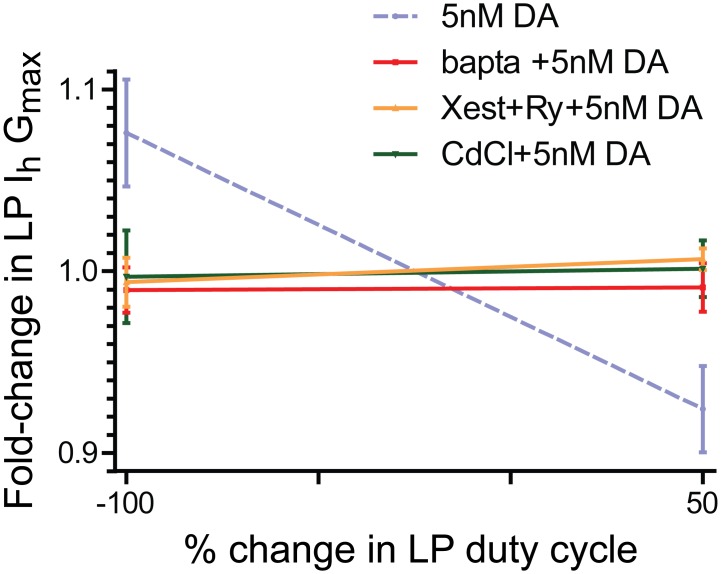
Fig 6. The slope of the LP Ih activity-dependence curve in 5nM DA reflects changes in Ca2+.
Experiments described in Fig. 3B were repeated for-100 and +50, except that an additional drug(s) to disrupt Ca2+ dynamics was also continuously superfused beginning at t = -20min (BAPTA or xestospongin C + ryanodine) or t = -5min (CdCl2). The fold-changes in LP Ih Gmax (mean+SEM) were plotted for each of the three treatment groups. Linear regression analyses and paired t-tests for each treatment group showed that in every case, the slope of the line was not significantly different from zero and the fold changes at-100 and +50 were not statistically significant. The original experiment from Fig. 3B (dashed line) is shown for comparison.

