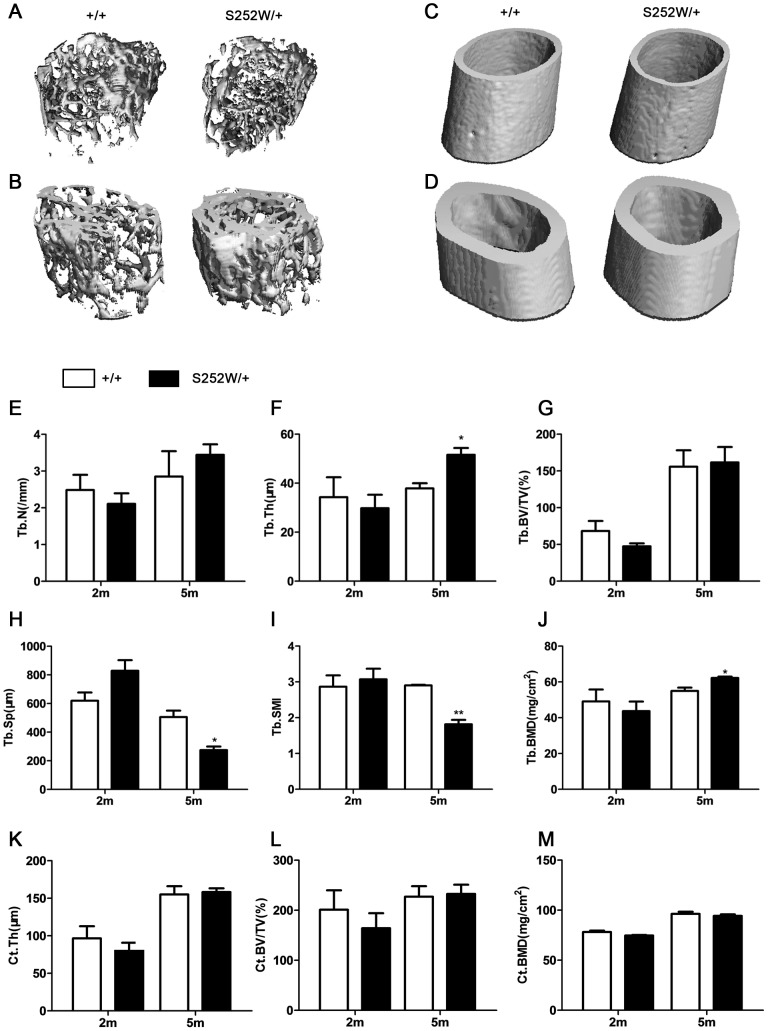
Figure 1. Bone abnormalities in Fgfr2 S252W/+ mice.
Quantitative micro-CT analyses of distal femoral metaphysic and middle shaft from wild-type and Fgfr2 S252W/+ at 2 months and 5 months. (A and C) Three-dimensional images showed reduced trabecular and cortical bone at 2 months, but (B and D) there was more trabecular and cortical bone in mutant mice at 5 months. (E–G, J–M) Quantification of the structural parameters of the femoral metaphysis revealed that Tb.N, Tb.Th, Ct.Th, and Tb.BV/TV, Ct.BV/TV, Tb.BMD, and Ct.BMD were lower than in control mice, Tb.Sp and Tb.SMI were increased at 2 months in mutant mice relative to wild-type mice (n = 6)( H and I). (M) Although Ct.BMD levels were less at 5 months in mutant mice than in wild-type mice, Tb.N, Tb.Th, Ct.Th, and Tb.BV/TV, Ct.BV/TV, Tb.BMD levels were higher in mutant mice(E–G and J–L). (H and I) Tb.Sp and Tb.SMI were significantly less pronounced at 5 months in mutant mice than in wild-type mice (n = 6). Graphs show mean value ±SD (Student's t-test, *P<0.05, **P<0.01).

